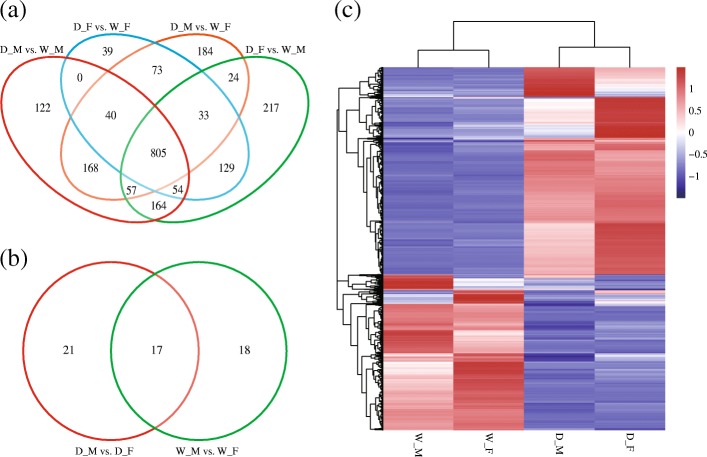
Fig. 3.
Hierarchical clustering and Venn diagram of the differentially expressed genes in the antennal transcriptome of the domestic and wild silkworms. a Venn diagram showing the number of the DEGs between the domestic and wild silkworms. b Venn diagram of the DEGs in D_M vs. D_F and in W_M vs. W_F. c Hierarchical clustering of all the differentially expressed genes. The mean values of FPKM from two biological replicates were used for hierarchical clustering using hcluster algorithm (http://www.omicshare.com/tools). The blue bands indicate low expressions; the red bands indicate higher expressions

