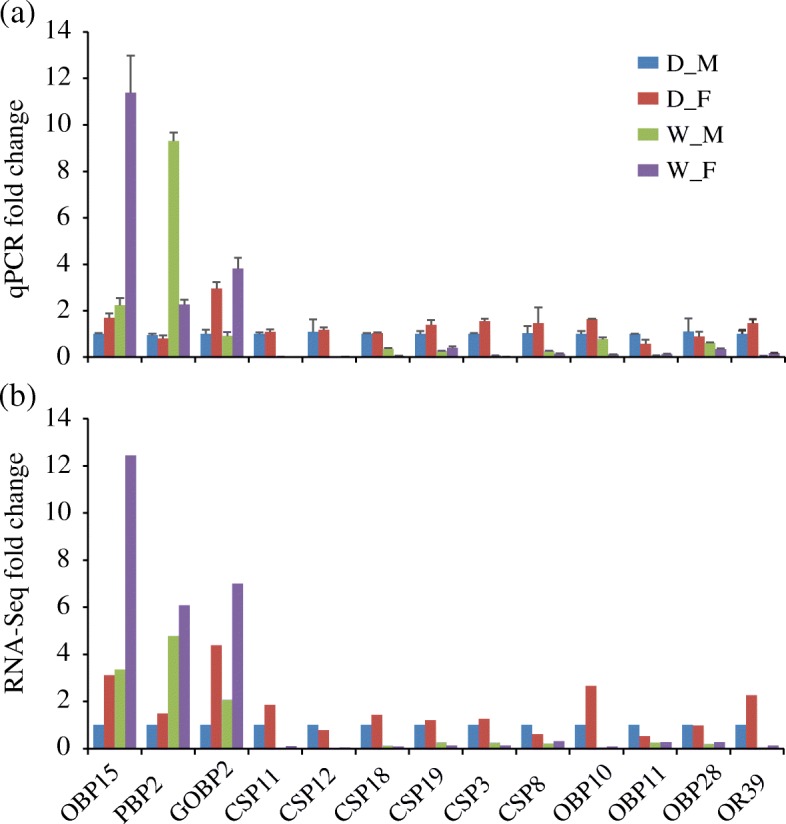
Fig. 4.

Validation of the DEGs by qPCR method. a Quantitative real-time PCR (qPCR) results. The relative expression of candidate genes was normalized against RpL3. The fold-change of each gene was calculated by dividing the relative expression level in D_M. SEM (the standard error of the mean) error bars are showed. b RNA sequencing results. The Y-axis indicates the fold change of FPKM compared with the corresponding FPKM values in D_M
