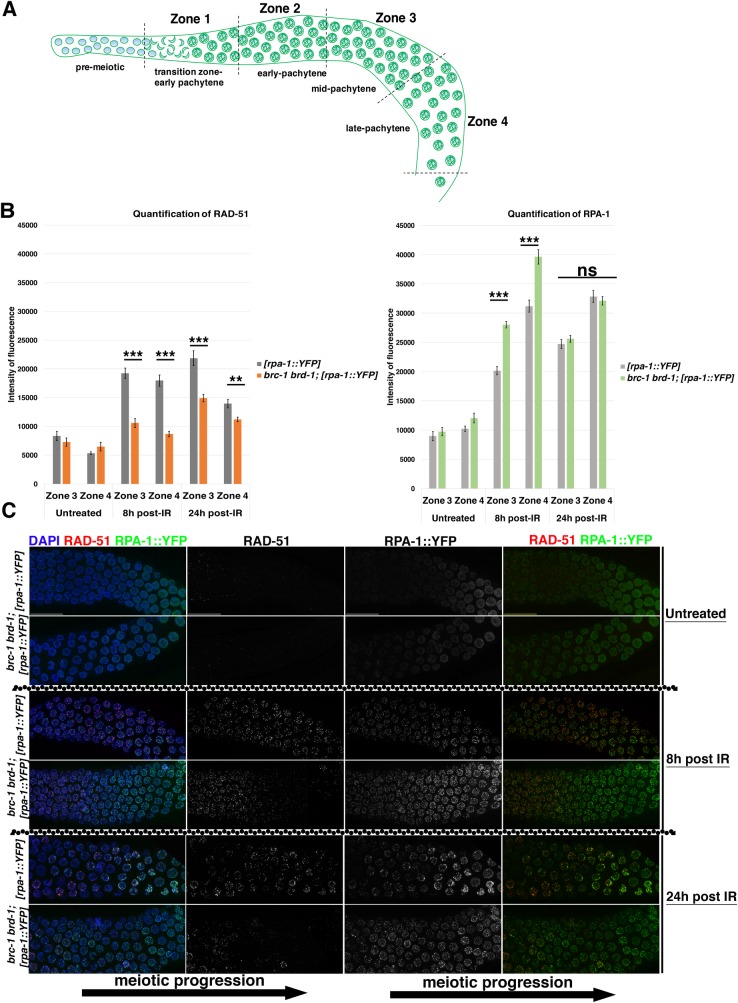
Fig 9. Efficient accumulation/exchange of RAD-51 and RPA-1 upon exogenous DNA damage requires BRC-1–BRD-1 function.
(A) Schematic representation of the germline, divided into four equal regions, starting from transition zone and ending at diplotene entry, in which the quantification of RAD-51 and RPA-1 accumulation was performed. (B) Time course analysis of RAD-51 and RPA-1::YFP accumulation in irradiated brc-1 brd-1 and controls. Worms were irradiated with 75 Gy IR and analyzed after 8 and 24 hours. The charts show quantification in zone 3 and 4, in which defective loading/retention of RAD-51 was observed. Germlines were acquired with the same settings, and quantification of fluorescence intensity was performed in Fiji. T test was conducted to assess statistical significance between the samples analyzed: *** p<0,0001, ** p = 0,001, ns = non-significant). (C) Representative examples of mid-pachytene regions from controls and brc-1 brd-1 mutants analyzed at different times post-irradiation. Meiotic progression from early towards late pachytene is indicated by black arrow. Scale bars, 30 μm.

