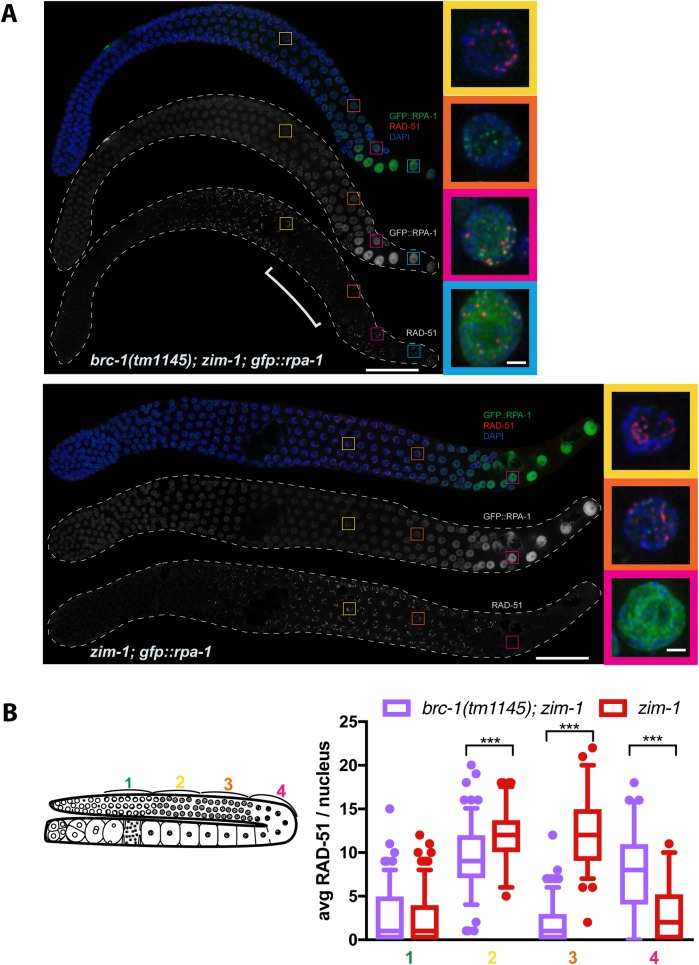
Fig 6. Inactivation of BRC-1-BRD-1 alters the pattern of RAD-51 foci in the zim-1 mutant.
A) Dissected germ lines from brc-1(tm1145); zim-1; gfp::rpa-1 and zim-1; gfp::rpa-1 worms stained with anti-RAD-51 (red), counterstained with DAPI (blue) imagined for GFP::RPA-1 fluorescence (green). Scale bar = 20 μm. Insets show selected nuclei from different regions of the germ line; bracket indicates RAD-51 “dark zone”. Images are projections through half of the gonad. A minimum of 3 germ lines were examined for each genotype. Scale bar = 1 μm. B) Schematic of germ line indicating zones for analysis of RAD-51 foci. Box whisker plots show average number of RAD-51 foci per nucleus in the different zones. Horizontal line of each box indicates the median, the top and bottom of the box indicates medians of upper and lower quartiles, lines extending above and below boxes indicate standard deviation and individual data points are outliers from 5–95%. Statistical comparisons by Mann-Whitney of brc-1(tm1145); zim-1 versus zim-1 in the different regions of the germ line; *** p<0.0001. A minimum of 3 germ lines were analyzed. Numbers of nuclei scored in each zone for brc-1; zim-1: 1 = 177; 2 = 138; 3 = 161; 4 = 61; zim-1: 1 = 159; 2 = 88; 3 = 103; 4 = 78.

