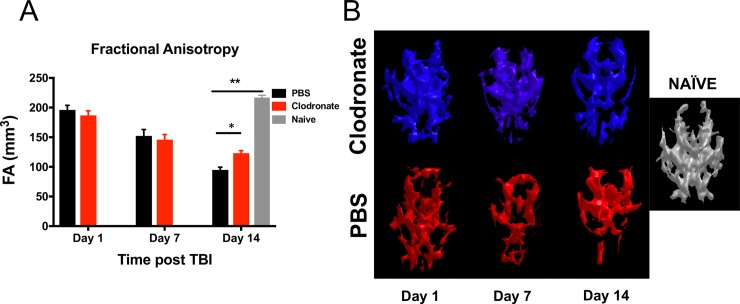
Fig 5. Global fractional anisotropy pattern alterations in monocyte-depleted vs. sham-depleted mice after traumatic brain injury.
A) At 14 days post—injury the volume of fractional anisotropy above threshold was significantly higher in monocyte-depleted mice (123.0 ± 4.4mm3) as compared to sham depleted mice (94.9 ± 4.6mm3; * p = 0.025), although both were lower compared to Naïve mice (216 ± 3.8mm3; ** p<0.0001). B) Side by side 3D-rendered representative images of fractional anisotropy patterns in monocyte-depleted vs. sham-depleted mice. Noticeable is the progressive loss of pattern as the injury progresses. The volume of FA and a representative 3D-rendered FA pattern from a naïve mouse is provided for comparison.

