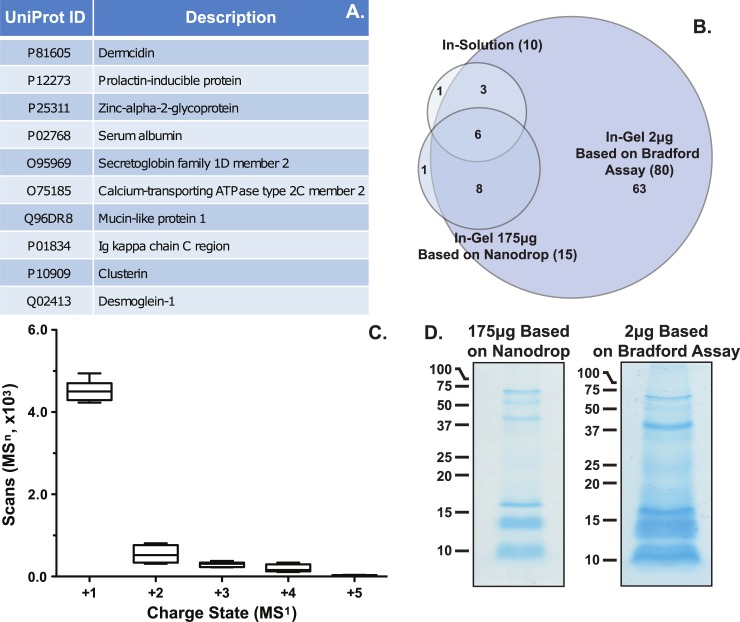
Fig 1. Proteomics results.
A) A summary of the protein groups identified from sweat via in-solution digestion. B) A Venn diagram of the protein groups identified from in-solution and in-gel digestion. C) Box-whisker plot of the number of MS1 charge states selected for MSn scans. D) Images of coomassie stained gels from 175μg sample loaded based on Nanodrop and 2μg sample load based on Bradford Assay. Data shows a small number of protein groups are identified from single sweat samples resulting from a high number of +1 charged peptides and a large group of low molecular weight proteins/peptides.

