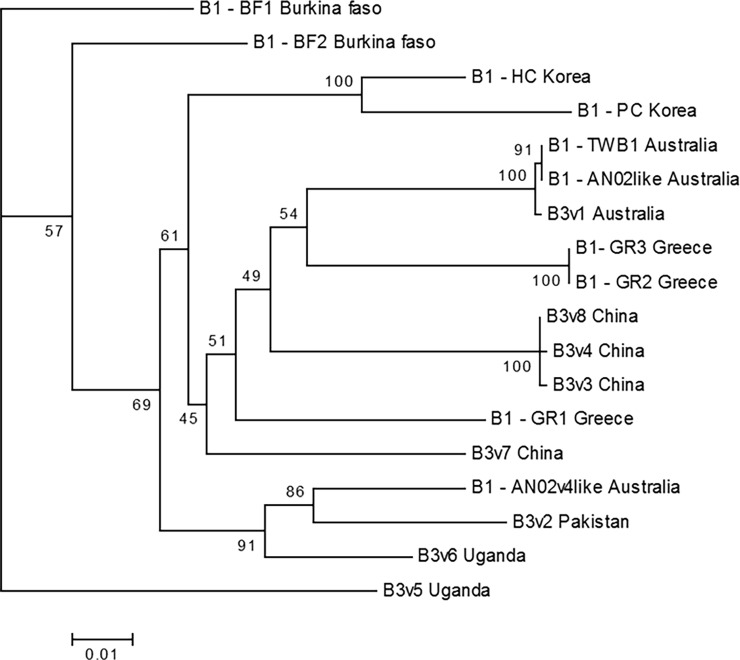
Fig 6. Maximum likelihood phylogeny of CYP337B1 and CYP337B3 alleles.
The maximum likelihood tree was generated in IQ-TREE with the HKY+G4 model of sequence evolution, using representative CYP337B1 and CYP337B3 intron sequences. Bootstrap values from 10,000 replicates are given on tree nodes. The eight CYP337B3 alleles are indicated with labels (v1:v8), different CYP337B1 alleles are indicated by B1- followed by an allele ID and the country of origin. Sequences and related NCBI identifiers can be found in S3 Table and S1 File.

