Figure 2.
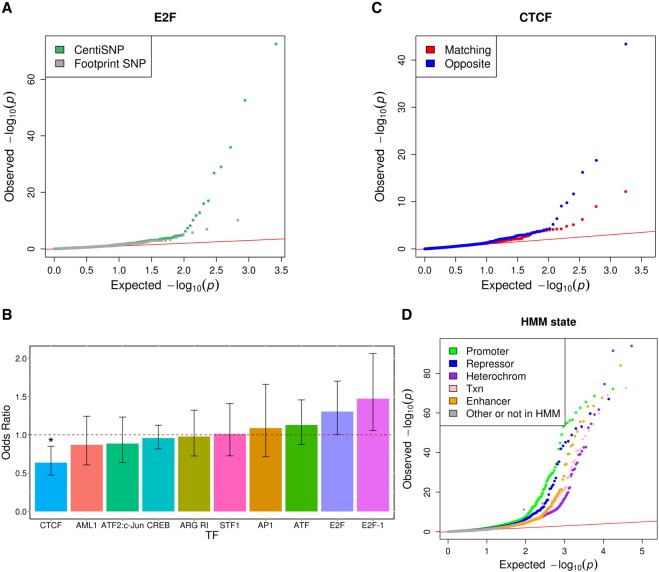
ASE for individual transcription factors. (A) QQplot depicting the ASE P-value distributions from QuASAR-MPRA, for SNPs overlapping with E2F footprint annotations. SNPs predicted to alter binding (CentiSNPs) are represented in green, and SNPs that are in E2F but predicted to have no effect on binding are in gray. (B) Enrichment for ASE in individual transcription factor binding sites calculated when motif strand matched the BiT-STARR-seq oligo transcription direction. Odds ratio (y-axis) for each transcription factor tested (x-axis) is shown in the bar plot; error bars are the 95% CI from the Fisher's exact test. Odds ratios below the dotted line represent enrichment for opposite direction oligo/motif configuration. Stars are shown above significant results (Bonferroni adjusted P-value <0.05). (C) QQplot depicting the ASE P-value distributions from QuASAR-MPRA, overlapping with CTCF footprint annotations. The SNPs where the motif strand matches the BiT-STARR-seq oligo direction relative to the TSS are in red, and blue shows where the motif strand is the opposite of the BiT-STARR-seq direction. (D) QQplot depicting the ASE P-value distributions from QuASAR-MPRA, overlapping with chromatin state annotations.

