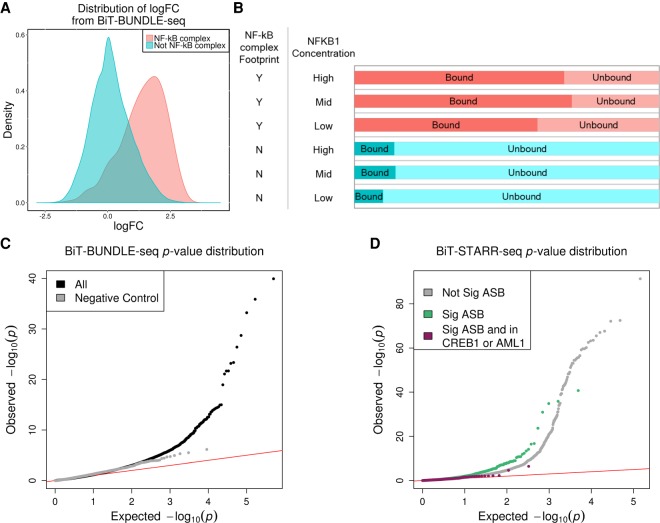
Figure 3.
Allele-specific binding for NFKB1. (A) Density plot of the logFC (from DESeq2) between bound and unbound DNA fractions from the BiT-BUNDLE-seq experiment. Regions in red are those containing a SNP in a NF-κB complex footprint; regions in blue are those containing a SNP in footprints for other transcription factors. (B) Bar plot representing the number of independent enhancer regions in bound (dark color, DESeq2 logFC > 1 and FDR < 1%) and unbound (light color) DNA. NFKB1 concentration and presence of a NF-κB complex footprint are indicated in the two columns on the left of the panel. (C) QQplot depicting the P-value distributions from testing for ASB signal specific to the bound DNA fraction using ΔAST (black) and SNPs in the negative control group (gray). (D) QQplot depicting the ASE p-value distribution from QuASAR-MPRA for SNPs with significant (FDR < 10%) ASB (green), SNPs with significant (FDR < 10%) ASB and are also in CREB1 or AML1 footprints (maroon), or not significant ASB (gray) in the BiT-BUNDLE-seq experiment.

