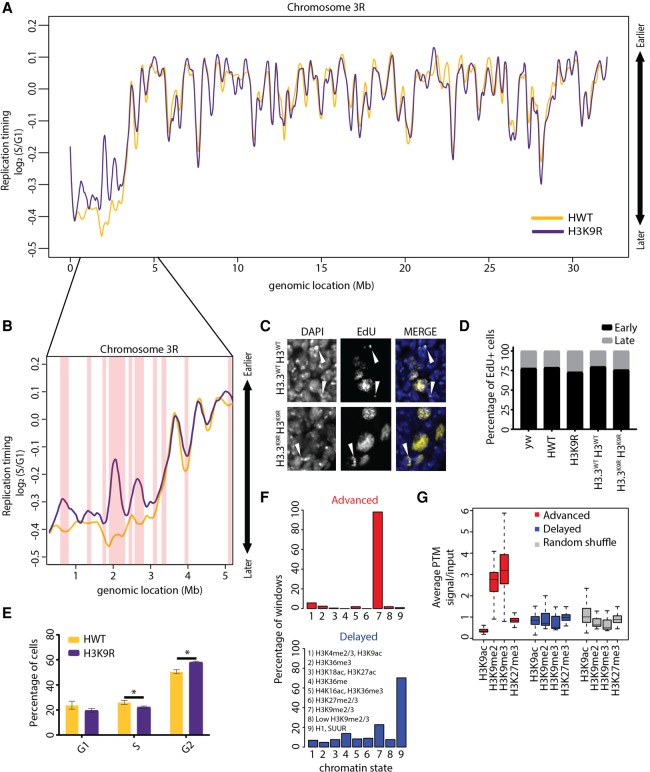
Figure 2.
Analysis of replication timing in H3K9R mutants. (A) Log2 S/G1 RT values at 100-kb windows with 10-kb slide for 12× HWT (histone wild type; yellow) and 12× H3K9R (purple) plotted across Chr 3R. See Supplemental Figure S5 for other chromosomes. (B) Approximately 5-Mb region of the pericentromeric heterochromatin of Chr 3R. Red vertical bars designate significant RT changes between H3K9R and HWT (P < 0.01, P value adjusted for multiple testing; absolute log2 fold change > 0.1; limma). (C) H3.3WT H3WT and H3.3K9R H3K9R (see Supplemental Materials for full genotype) first instar brains pulse-labeled for 1 h with EdU (yellow) and stained for DNA (blue; DAPI). White arrowheads designate late patterned EdU incorporation. (D) Percentage of EdU+ cells with early or late EdU incorporation patterns from ∼200 cells per genotype. There is no difference between genotypes (P > 0.05, χ2 test). (E) Cell cycle indices for HWT (yellow) and H3K9R (purple) wing disc cells acquired via FACS (calculated using the Dean-Jett-Fox model). Error bars indicate standard deviation of three experiments. (*) P < 0.05. (F) All advanced (red) or delayed (blue) 10-kb windows in H3K9R mutants were assigned to the nine chromatin states defined in flies (Kharchenko et al. 2011). Shown are the percentages of windows that overlap each chromatin state. (G) Average enrichment of modENCODE H3K9ac, me2, me3, and H3K27me3 signal from third instar larvae at 10-kb windows of advanced (red), delayed (blue), or randomized set of windows (Celniker et al. 2009).

