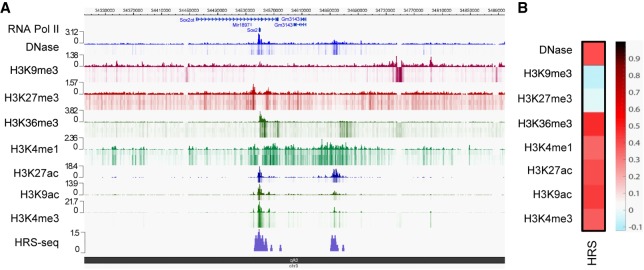
Figure 5.
HRSs are associated with active epigenetic marks. (A) Browser snapshot showing the HRS density at the Sox2 gene locus on mouse Chromosome 3 as determined by HRS-seq experiments performed in ESCs. Tracks displaying DNase I–sensitive sites, RNA PolII peaks as well as ChIP-seq data for the indicated epigenetic marks (ENCODE E14 ESC data) were plotted using the WashU EpiGenome Browser. (B) Heat map depicting the Pearson correlation coefficients obtained between ESC HRSs and sequences (10-kb bins) enriched in distinct epigenetic marks as indicated on the figure. (Black/red) High positive correlation coefficient; (white/blue) low null/negative correlation coefficient.

