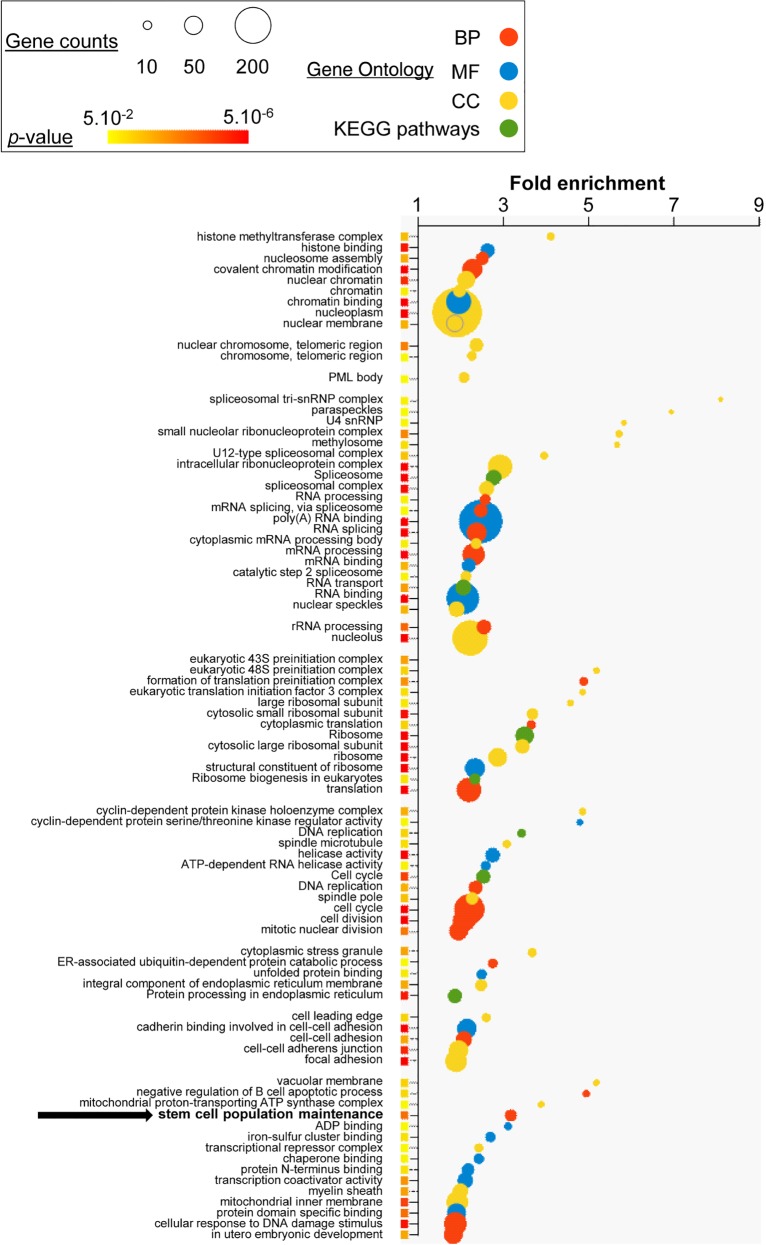
Figure 6.
HRS-associated genes are housekeeping, as well as cell-type–specific, genes. DAVID Gene Ontology analyses were performed on genes for which at least one TSS was mapping in the ESC HRSs. KEGG pathways (green) and GO terms related to biological processes (red), molecular functions (blue), and cellular components (yellow) are depicted by circles as a function of fold enrichments. For each indicated term, circle areas are proportional to gene counts. Only the most significant terms (P-value <0.05 and fold enrichment >1.80) are shown. P-values <5 × 10⁻⁶ are depicted by red squares (for exact values, see Supplemental Table S4).

