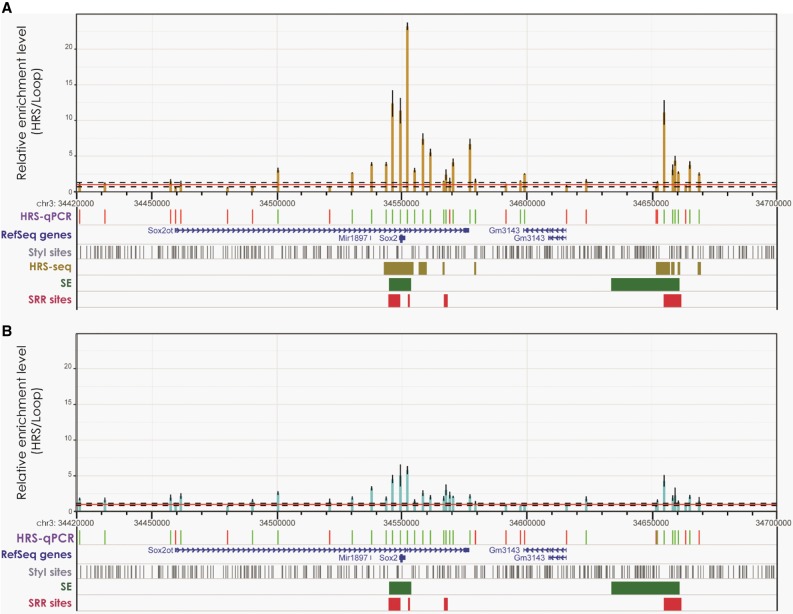
Figure 7.
HRSs are associated with highly expressed cell-specific genes. The enrichment levels (HRS vs. Loop fractions) of StyI fragments at the Sox2 locus (Chr 3: 34,400,000–34,670,000, mm9 assembly) were determined by qPCR (HRS-qPCR) in ESCs (A; brown bars) or in neurons (B; blue bars). The red horizontal line corresponds to the mean local background level (value 1), and dashed lines depict the mean noise band as defined in the Supplemental Methods. The positions of StyI fragments identified by HRS-seq, as well as RefSeq genes, StyI sites, Super-enhancers (SE) (Khan and Zhang 2016) and Sox2 Regulatory Regions (SRR) (Zhou et al. 2014), are indicated below the histogram. The HRS-qPCR track indicates StyI fragments investigated in the experiment. Green bars represent HRSs (StyI fragments having enrichment levels above the noise band), red bars indicate StyI fragments that are not HRSs. n = 3 (technical replicates) for each experiment; error bars, SEM.

