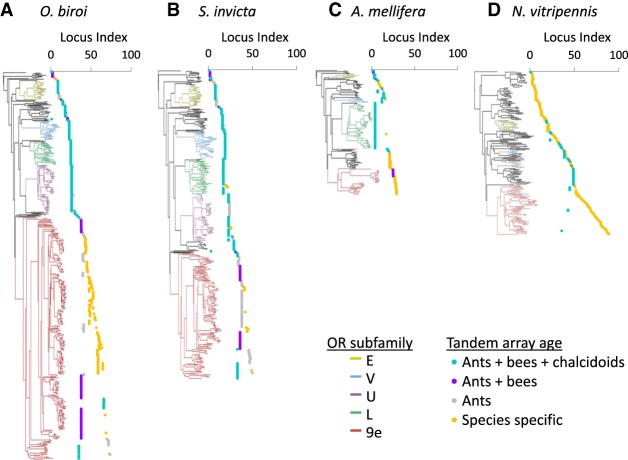
Figure 2.
Phylogeny and genomic organization of odorant receptors in four Hymenoptera species. Branches from the five largest ant OR subfamilies are colored by subfamily. OR loci indices are assigned by ordering loci as they appear in the phylogeny from top to bottom. Sets of vertically aligned points represent a single tandem array, while breaks in a line represent transposition events. Loci indices assigned this way are not homologous between species. Loci ages are indicated by color and calculated via phylostratigraphy and synteny analysis (see Methods). The few large, contiguous, and old tandem arrays in the top half of A and C and throughout B indicate tandem duplications as the predominant drivers of gene expansion in these gene clades. The many short species-specific tandem arrays in the bottom half of A and C and throughout D indicate that genomic transpositions followed by tandem duplications drove expansions in these clades.

