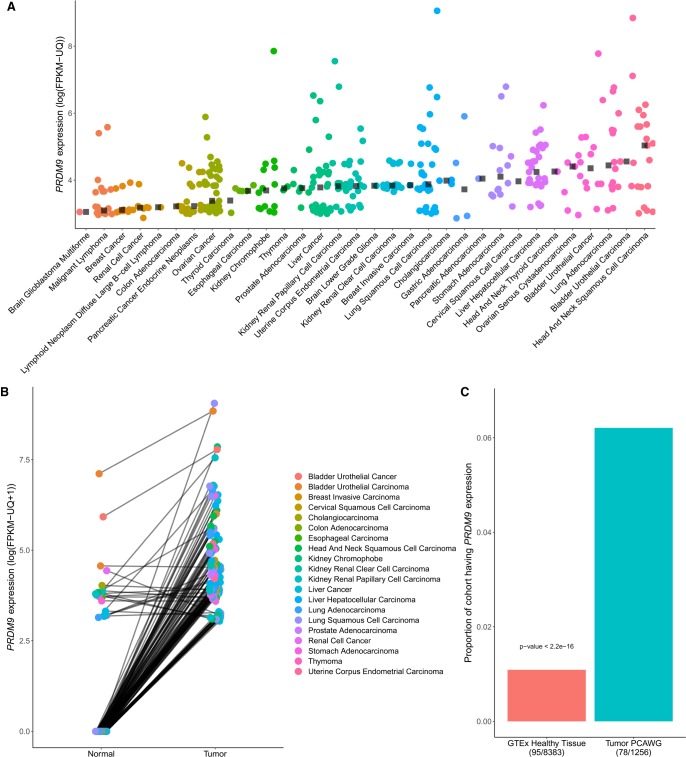
Figure 1.
Characterization of aberrant PRDM9 expression across cancer types. (A) A total of 365 samples expressing PRDM9 above 10 FPKM-UQ across 39 cancer types from the PCAWG and TCGA data sets (n = 1879), after a correction to account for the high homology between PRDM9 and PRDM7 (Methods; see Supplemental Fig. S2). Black squares represent the median of PRDM9 expression above a threshold of 10 FPKM-UQ within each cancer type. (B) PRDM9 expression in 128 tumor samples expressing PRDM9 above a threshold of 10 FPKM-UQ and their matching normal samples, across cancer types within the TCGA and the PCAWG cohorts (n = 813 pairs). Data points are colored according to cancer type, and lines connect tumor and normal samples originating from the same patient. Cancer samples have higher PRDM9 expression than their matching healthy tissues (one-sided Wilcoxon signed-rank test: P < 2.2 × 10⁻¹⁶), a result consistent within each cancer type where at least three sample pairs were expressing PRDM9 (Fisher's method with one-sided Wilcoxon signed-rank test: P = 2.28 × 10⁻²⁰) (Supplemental Table S1). (C) Proportion of samples expressing PRDM9 in the cancer cohorts (PCAWG and TCGA) compared with the proportion of samples expressing PRDM9 in the GTEx cohort, excluding testes. The proportion of samples expressing PRDM9 in cancer samples is significantly higher than that of healthy tissues.

