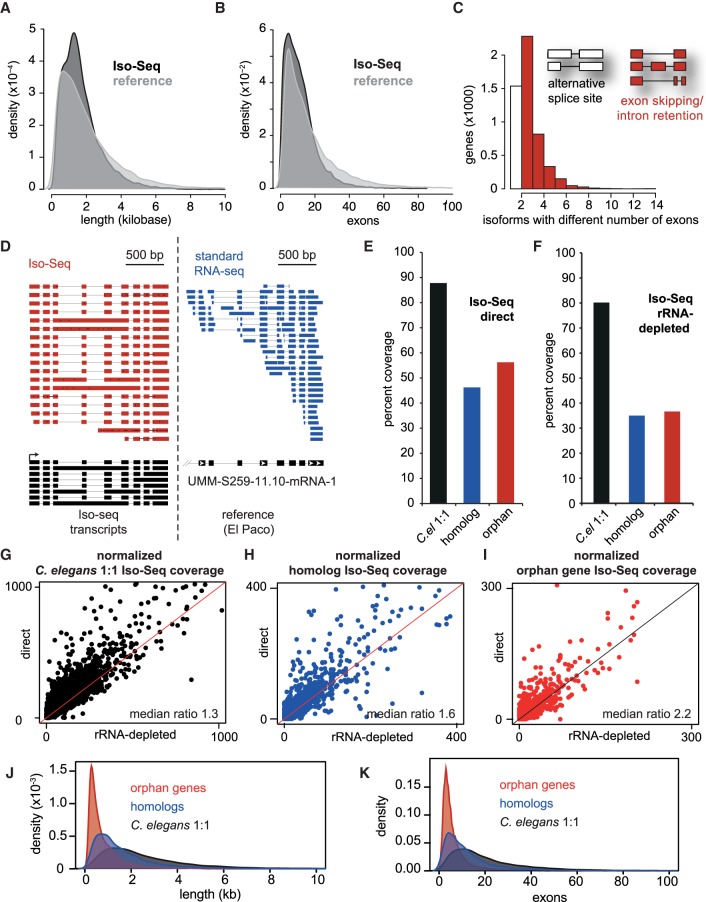
Figure 2.
Long-read RNA sequencing (Iso-Seq) improves gene annotation, identifies alternative splicing, and can distinguish different evolutionary gene classes by gene structure. (A) Density distribution of cDNA gene lengths between the El Paco reference (gray) and Iso-Seq annotation (black). The Iso-Seq annotation was derived from guided assembly using StringTie (Pertea et al. 2016; Methods), and plots were created using the density function in R. (B) Density distribution of exons per gene between El Paco reference and Iso-Seq annotations. Method and color scheme are similar to A. (C) Alternatively spliced isoforms, defined as having multiple detected isoforms with the same start and stop coordinates. The white column represents genes containing isoforms that have the same exon–intron structure but different splice sites, and red columns represent genes containing isoforms with different numbers of exons due to intron retention or exon inclusion/exclusion. (D) Example locus of Iso-Seq reads compared to standard short-read RNA-seq. Also shown are Iso-Seq-assembled isoforms compared to the single reference gene umm-S259-11.10-mRNA-1, visualized using Integrated Genome Viewer (IGV). (E,F) Percent coverage of evolutionary gene classes by Iso-Seq with either the “direct” method (E) or rRNA-depleted “total RNA” (F). (G–I) Iso-Seq coverage per gene of each evolutionary class in direct (y-axis) compared to total (x-axis). Coverage was determined by BEDTools, and median ratios of direct/total RNA are presented. Lines (slope = 1, y intercept = 0) represent equal coverage between methods. (J,K) Similar density distributions of cDNA length and exon number as in A and B, but for the three evolutionary gene classes.

