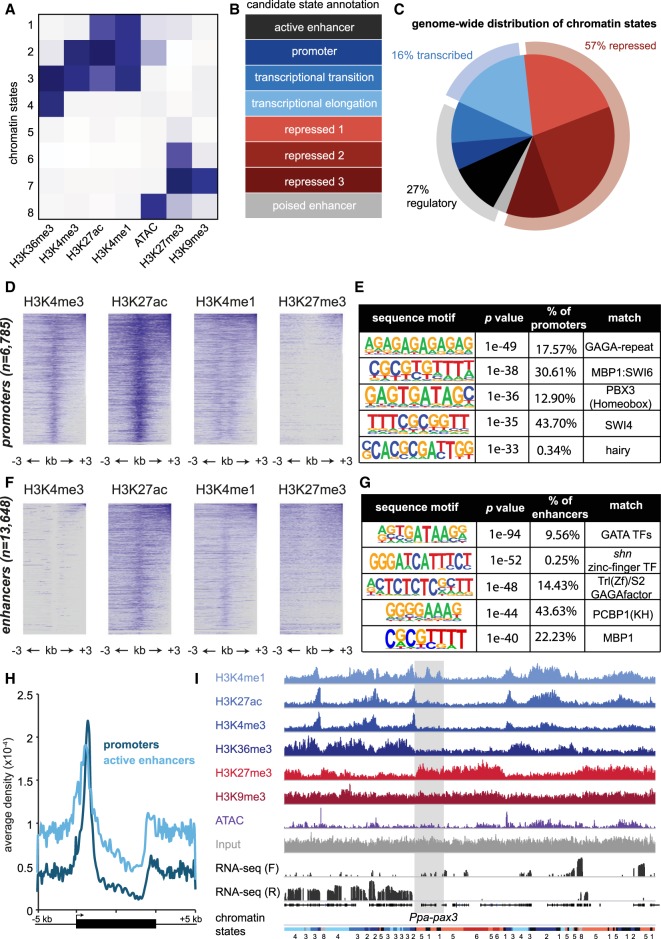
Figure 3.
The epigenome of Pristionchus pacificus. (A) Chromatin states determined through a hidden Markov model (ChromHMM) clustered by histone modifications and ATAC-seq, normalized by coverage. Darker blue represents greater enrichment. (B) Candidate annotation of each chromatin state according to ENCODE/modENCODE data sets (Ernst et al. 2011; Roadmap Epigenomics Consortium et al. 2015). Repressive chromatin states are divided into three categories according to standard definitions of constitutive (repressed 3) and facultative (repressed 1 and 2) heterochromatin. Poised enhancers are defined according to previous annotations of loci containing H3K27me3 and DNase sensitivity. (C) Genome-wide distribution of chromatin states, and further clustering into three categories: repressive, transcribed, or regulatory. (D) Heatmap of indicated histone modifications for promoter chromatin states, in which each line represents a single 6-kb locus centered on the promoter. Heatmap matrices were generated in HOMER, clustered from highest to lowest enrichment, and plotted in R. (E) Position weight matrices of de novo sequence motifs in promoters, queried using HOMER. The table also includes the percentage of promoters containing motif, P-value, and matches to known transcription factors. (F,G) Similar to D,E, but for enhancer chromatin states. (H) Average density plots of promoter (dark blue) and enhancer (light blue) locations relative to gene bodies, extended 5 kb in each direction from their 5′ and 3′ ends. Density values measured using HOMER and plotted in Excel. (I) Epigenomic data of histone modification ChIP-seq, ATAC-seq, and RNA-seq surrounding the Ppa-pax3 gene. Input is included as a reference, and chromatin state annotations are included at the bottom matching the colors in C. ChIP-seq and ATAC-seq coverage are autoscaled per sample, and RNA-seq forward (F) and reverse (R) read coverage is in log-scale.

