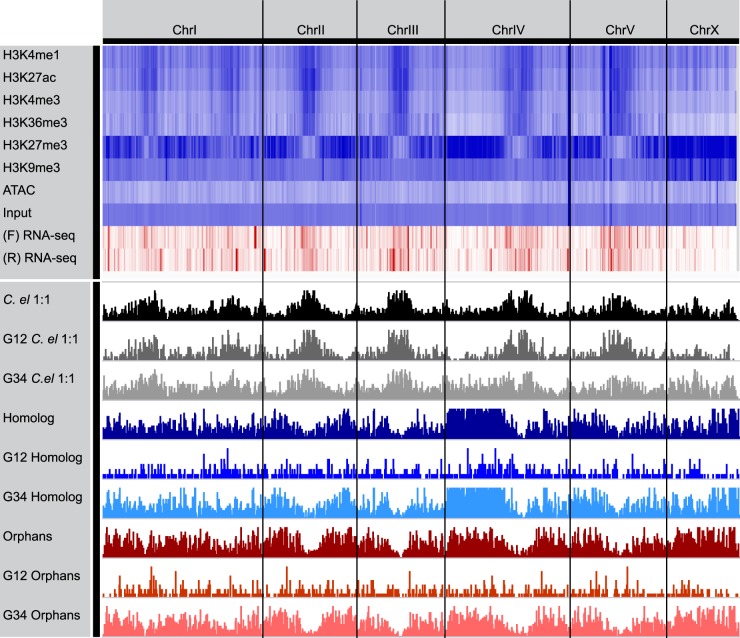
Figure 6.
Chromosome-wide distribution of histone modifications reveals distinct patterns for evolutionary gene classes and a double-band pattern on Chr I. Genome-wide patterns of histone modifications from ChIP-seq and ATAC-seq presented as a heatmap with increasing abundance from white to blue, and white to red for RNA-seq (normalized by depth). Also plotted are gene densities of each evolutionary class binned by expressed (groups 1 and 2) or transcriptionally repressed (groups 3 and 4) for each class.

