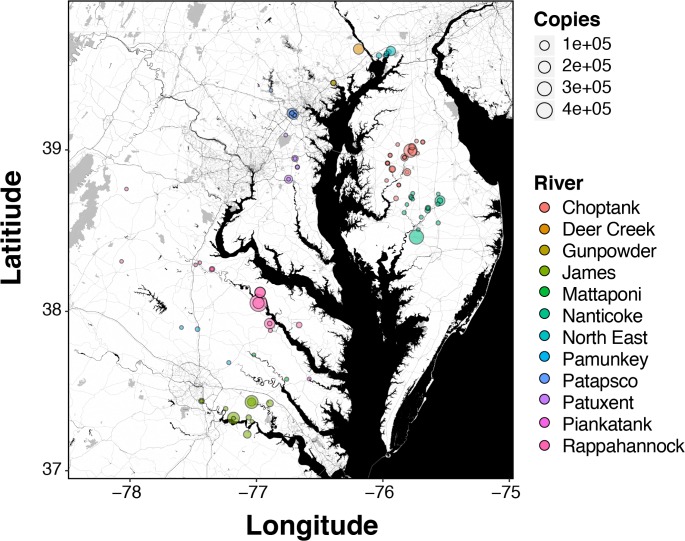
Fig 4. Map of positive river herring eDNA detections across Chesapeake Bay.
Size of data points (positive detections) proportional to the magnitude of amplification (mean mtDNA copies) and are colored by tributary. eDNA copy numbers for each sample reflect the initial number of mtDNA copies per 40 mL water filtered.

