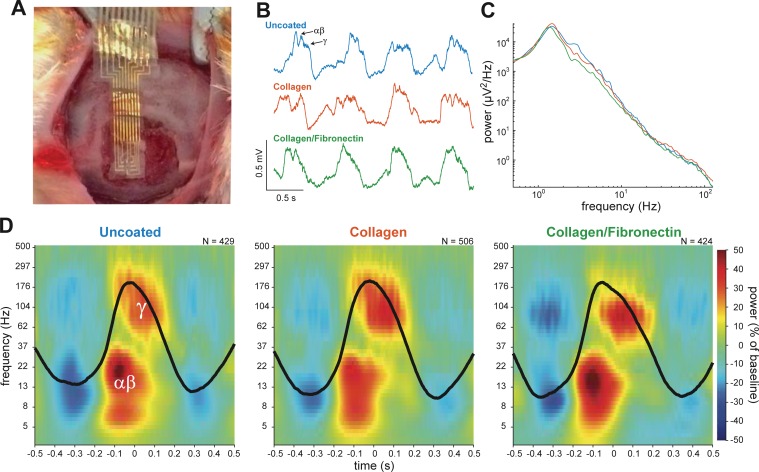
Fig 3. In vivo acute recordings of cortical potentials.
(A) Photograph of the electrode array placed on the surface of the rat barrel cortex. (B) Representative 2 s segments of data recorded from the gold (blue trace), collagen-coated (orange trace), and collagen-fibronectin-coated (green trace) electrodes. Note the large amplitude, ~1-Hz oscillations and smaller, faster rhythms occurring near the peak of each cycle (arrows). (C) Average power spectral density calculated over a 1 min time window for the three electrode types. D, Average cycle-triggered wavelet scalograms for the three electrode types. The color indicates power relative to the phase of the 1-Hz cycle (average cycle shown in black). The number of cycles used to generate the averages is indicated. Power in two frequency ranges, αβ = 5–30 Hz and γ = 50–300 Hz, was coupled to two distinct phases, upslope and peak, of the 1-Hz cycle.

