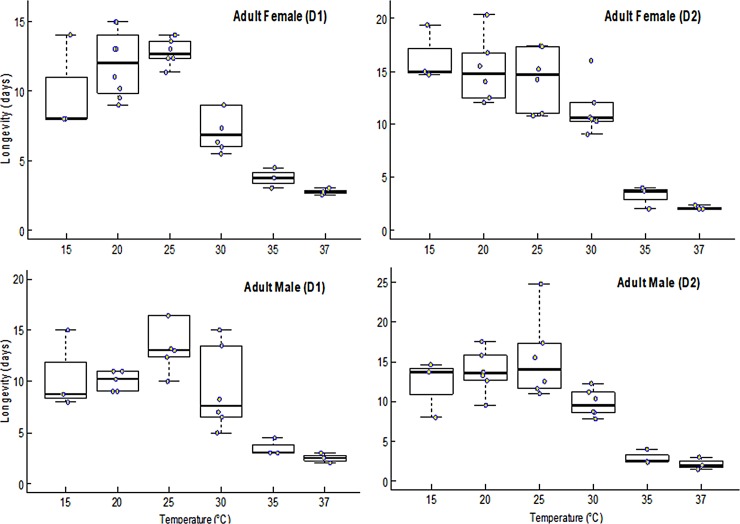
Fig 4. Boxplots showing adult black soldier fly female and male longevity at constant temperatures.
Middle quartile (line that divides the box into two parts) shows midpoint of the data. Middle box represents 50% of the scores for each treatment and the middle 50% values fall within the inter-quartile range.

