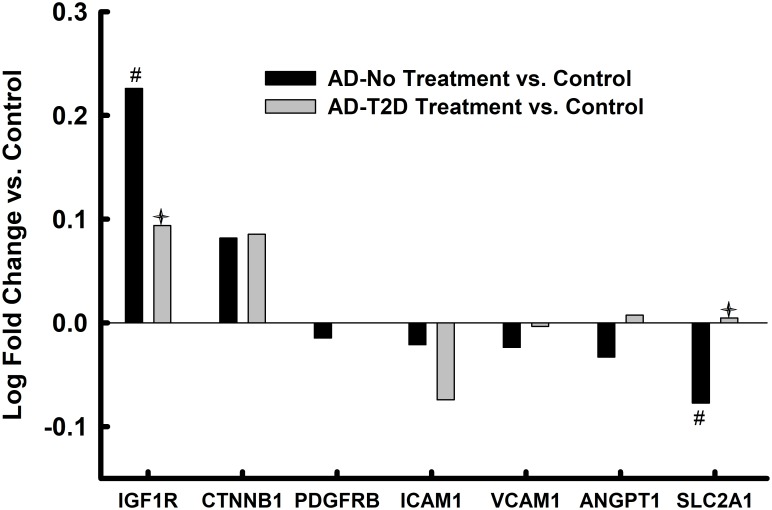
Fig 2. Endothelial cell markers in parahippocampal gyrus bulk tissue.
Values represent relative log fold change in persons with AD relative to controls and log fold change in persons with AD and T2D who had been treated with anti-diabetes agents. * = p<0.05 after FDR correction; # = p<0.05 without FDR correction; ✦ = p<0.05 AD-No Treatment vs. AD-T2D Treatment.

