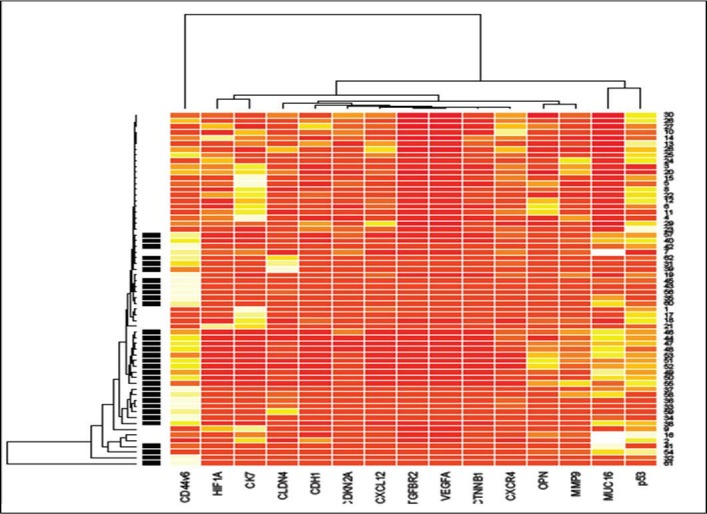
Fig 2. Unsupervised hierarchical clustering of 30 primary lung cancer samples and 32 advanced stage lung cancer liver metastatic samples based on 15 differentially expressed genes at a false discovery ratio level of 0.05.

Tumor identification appears at the top of the figure and each column represents gene expression of a single tumor. UniGene cluster ID or gene ID or ORESTES is shown in each row. The colored bar indicates the variation in gene expression in target samples as compared to reference cells i.e., red, more expressed and white, less expressed in target samples. The black lines of the dendrogram stand for the support for each clustering. The metric used was Euclidean distance, with complete linkage for distance between clusters.
