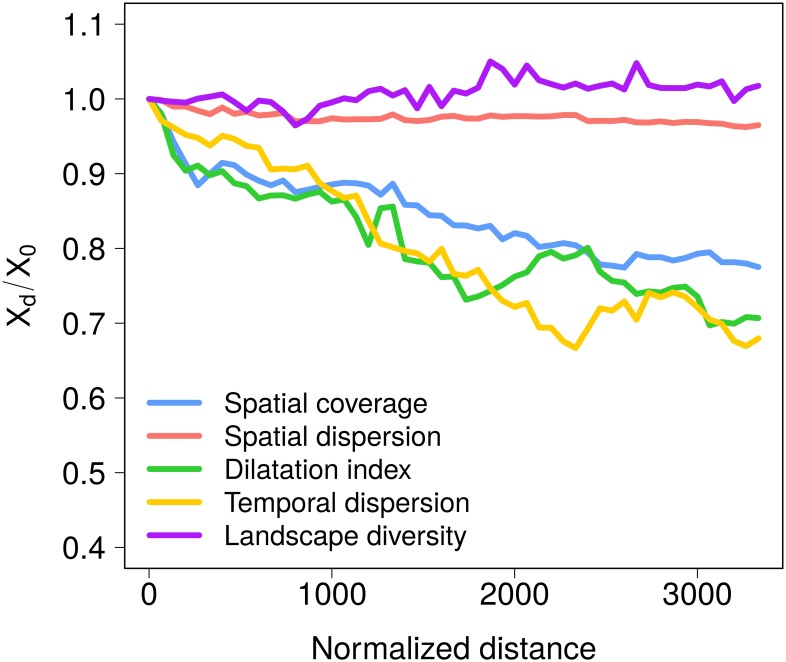
Fig 5. Effect of the distance traveled on the socio-ecological interactions.
Evolution of the spatial coverage (blue), the spatial dispersion (red), the spatial dilatation index (green), the temporal dispersion (yellow) and the landscape diversity (purple) as a function of the normalized distance. For each metric, the median over the 16 case studies is displayed. All metrics are normalized by the value obtained with a random null model. Similar plots for each case study are available in Fig G in S1 File. The effect of the spatial resolution on the spatial metrics is presented in Fig H in S1 File.

