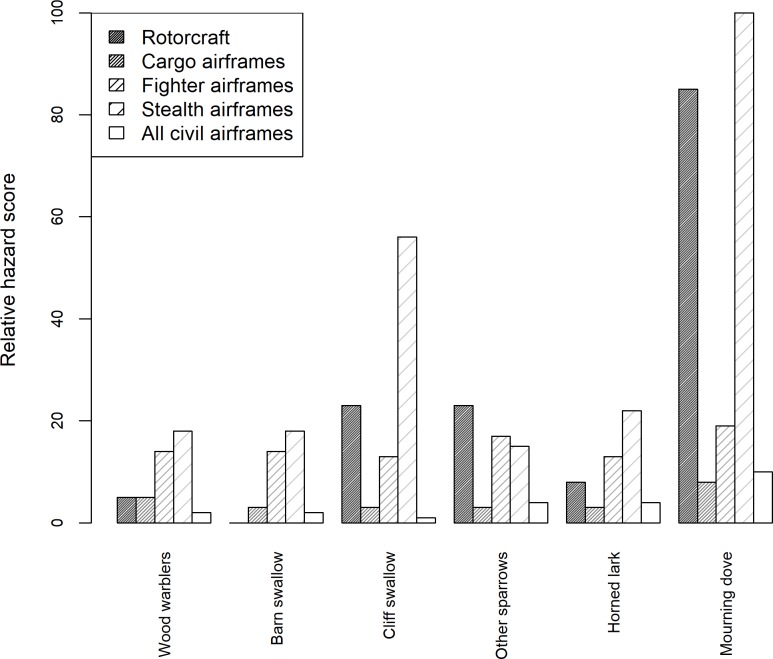
Fig 1. Comparison of relative hazard scores for 6 avian species groups for 4 military airframe groups and all civil airframes for 6 species.
Relative hazard scores are calculated from bird strikes within the U.S. See S2 Table for airframe group compositions. Civil relative hazard scores come from [11]. Species are ordered from left to right by ascending averaged body mass.

