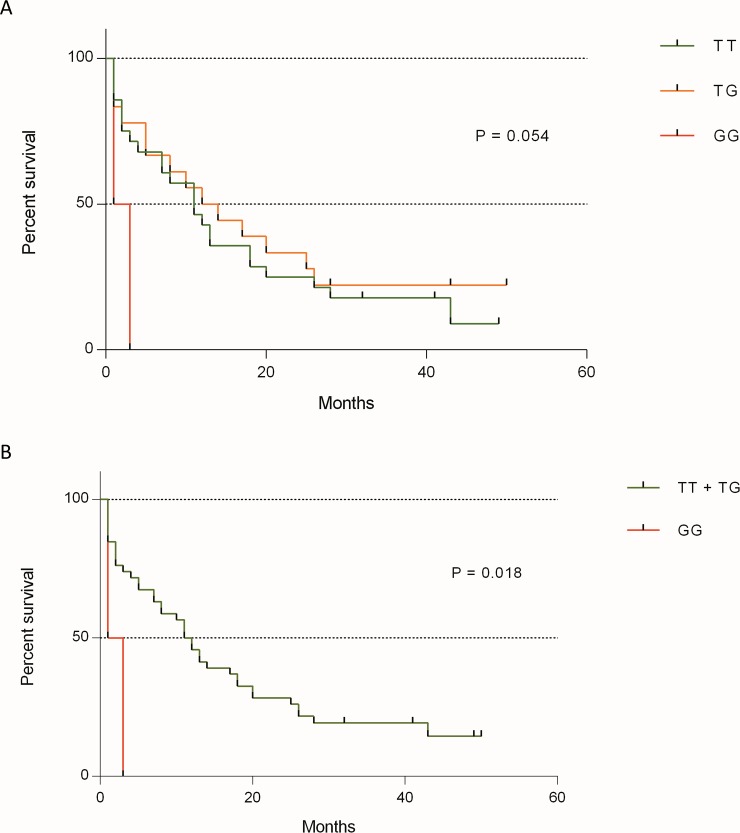
Fig 1. Kaplan-Meier survival estimates.
(A) Survival analysis of the AGT rs5050 genotypes (TT in green, TG in orange, and GG in red) separately, showing the shorter survival in GG-genotype patients (p = .05). (B) Comparing GG-genotype against TT + TG-genotypes of AGT rs5050, patients harboring GG-genotype (in red) exhibited lower survival rates compared to TT + TG (in green) genotypes patients (2 vs. 11.5 months [p = .01]).

