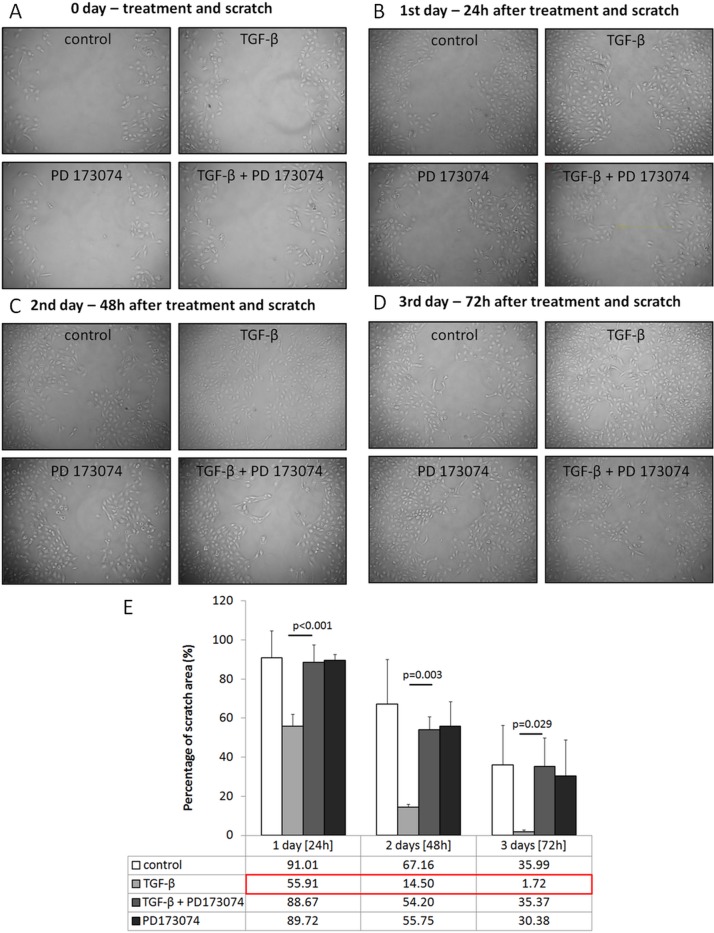
Fig 2. Scratch assay analysis in experimental groups.
(A-E) Representative photomicrographs of scratch assay analysis of control cells and cells treated with TGF-β1 alone or in combination with PD173074 at indicated time points (percentage was calculated in comparison to day 0, n = 3 independent measurements, data are presented as means±s.d., values of p were calculated using Mann-Whitney U test for the first two experimental days and Student's t test for two independent samples for the 3rd day).

