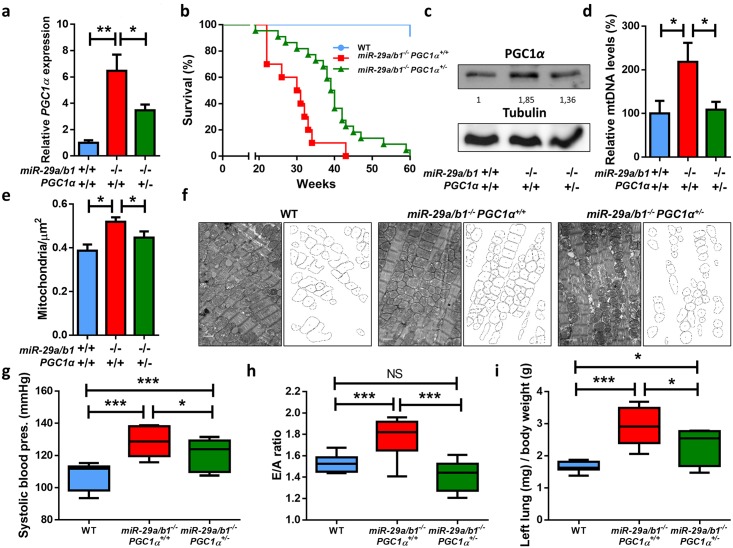
Fig 6. PGC1α is up-regulated in miR-29a/b1−/− mice, and its reduction extends life span and rescues cardiovascular pathology.
(A) PGC1α expression in hearts from wild-type (n = 7), miR-29a/b1−/− PGC1α+/+ (n = 13), and miR-29a/b1−/− PGC1α+/− (n = 7) mice. (B) Kaplan–Meier survival plot of wild-type (n = 11), miR-29a/b1−/− PGC1α+/+ (n = 10), and miR-29a/b1−/− PGC1α+/− (n = 22) mice (p < 0.01 for the comparison between miR-29a/b1−/− PGC1α+/+ and miR-29a/b1−/− PGC1α+/− mice; log-rank/Mantel-Cox test Bonferroni-corrected for multiple comparisons). (C) Western blot of PGC1α in hearts from wild-type, miR-29a/b1−/− PGC1α+/+, and miR-29a/b1−/− PGC1α+/− mice (relative densitometric quantification represented as arbitrary units). (D) Analysis of mtDNA quantity expressed as a percentage of levels in wild-type (n = 6), miR-29a/b1−/− PGC1α+/+ (n = 4), and miR-29a/b1−/− PGC1α+/− (n = 6) mice. (E) Number of mitochondria per μm2 in wild-type (six micrographs from two different mice), miR-29a/b1−/− PGC1α+/+ (22 micrographs from four different mice), and miR-29a/b1−/− PGC1α+/− (22 micrographs from three different mice) animals. (F) Electron micrographs and schematic representation of mitochondria of hearts from wild-type, miR-29a/b1−/− PGC1α+/+, and miR-29a/b1−/− PGC1α+/− mice (original magnification: ×15.000, scale bar: 1 μm). (G) Systolic blood pressure values from wild-type (n = 10), miR-29a/b1−/− PGC1α+/+ (n = 8), and miR-29a/b1−/− PGC1α+/− (n = 6) mice. (H) Quantification of E/A fraction in wild-type (n = 10), miR-29a/b1−/− PGC1α+/+ (n = 9), and miR-29a/b1−/− PGC1α+/− (n = 6) mice. (I) Ratio of left lung weight to body weight in wild-type (n = 8), miR-29a/b1−/− PGC1α+/+ (n = 5), and miR-29a/b1−/− PGC1α+/− (n = 5) mice. Original raw data can be found in S1 Data file. E/A, early and late diastolic filling velocities ratio; mtDNA, mitochondrial DNA; NS, non-significant; WT, wild-type.

