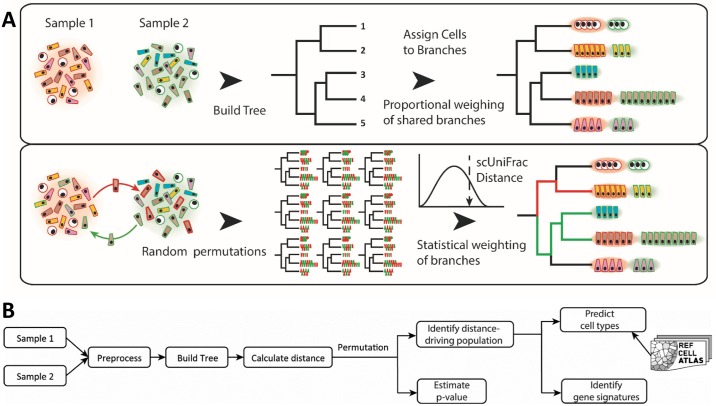
Fig 1. Overview of the sc-UniFrac method.
(A) A hierarchical tree is built by clustering the combined single-cell transcriptome profiles from two samples and by calculating distances between cluster centroids. Each cell, as a function of their cluster membership, is then assigned to branches. Branch lengths weighted by the relative abundance of each sample are used to calculate the sc-UniFrac distance. In the second step, the sample labels of all cells are swapped without altering the tree topology to generate a null distribution of sc-UniFrac distances, where a p-value for the sc-UniFrac distance can be calculated. (B) Workflow overview of the sc-UniFrac package for characterizing dissimilarities between two samples.

