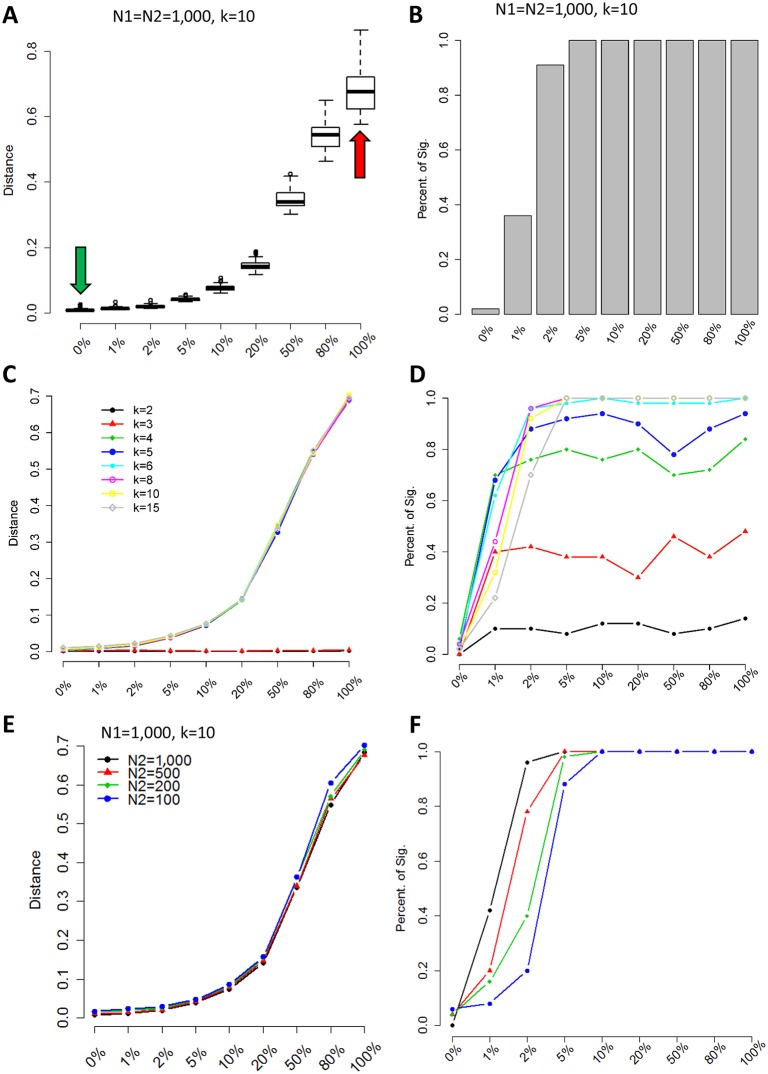
Fig 2. Simulation data reveal sc-UniFrac to be sensitive and robust.
(A) Two groups (N1 and N2) of 1,000 cells were selected from CD8 and CD4 cells identified in the Wishbone dataset (S1 Data) [25]. N1 is always composed of 100% CD8 cells, while N2 is composed of CD8 cells and different proportions of CD4 cells (indicated on x-axis). Green and red arrows represent CD8/CD8 (completely similar) and CD8/CD4 (completely dissimilar) comparisons, respectively; y-axis is the sc-UniFrac distance calculated over n = 50 runs with k = 10. Boxes represent the first and third quartiles, and bars represent maximum and minimum values. (B) Sensitivity of sc-UniFrac evaluated by the fraction of incidences that a statistically significant sc-UniFrac distance was returned over n = 50 runs, as a function of increasing dissimilarity between N1 and N2 using the same simulation scheme as panel A. (C) Mean sc-UniFrac plotted as in panel A with varying k parameter. (D) Fraction significant sc-UniFrac detected plotted as in panel B with varying k parameter. (E) Mean sc-UniFrac plotted as in panel A with N1 = 1,000 but a varying N2 size to determine the effect of dataset size imbalance on sc-UniFrac. (F) Fraction significant sc-UniFrac detected plotted as in panel B with N1 = 1,000 and varying N2 size.

