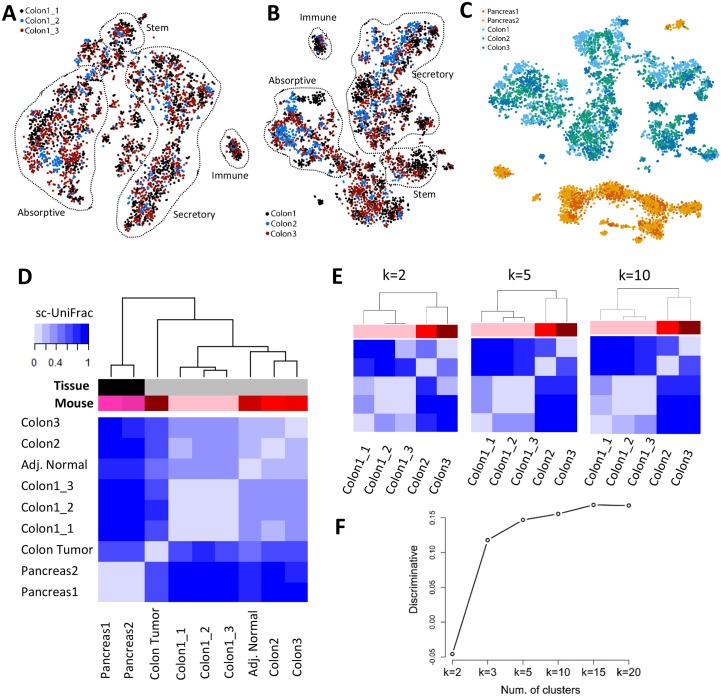
Fig 3. sc-UniFrac statistically determines dissimilarities between single-cell data landscapes.
t-SNE plots of (A) technical and (B) biological replicates of scRNA-seq data generated from the adult murine colonic mucosa. Replicates were combined for t-SNE analyses and labeled with different colors. Outlined populations were identified with canonical markers. (C) t-SNE plot depicting E14.5 pancreatic islet and adult colonic mucosa scRNA-seq data in different mice, showing segregation by organ type. (D) Hierarchical clustering by sc-UniFrac of scRNA-seq landscapes generated from E14.5 pancreatic islet and adult colonic mucosa (indicated by tissue label), with technical and biological replicates (indicated by mouse label), as well as colonic tumor and adjacent normal isolated from an induced Lrig1CreERT2/+;Apcfl/+ mouse. Heat represents sc-UniFrac distance between two samples. (E) Hierarchical clustering by sc-UniFrac of single-cell landscapes of technical and biological replicates of the colonic mucosa while varying parameter k. (F) Discriminate analysis of sc-UniFrac on biological and technical replicates. Discriminative ability, as defined by the smallest distance between biological replicates minus the largest distance between technical replicates, plotted against k. Data from GSE102698, GSE114044, GSE117615, GSE117616. scRNA-seq, single-cell RNA-sequencing; t-SNE, t-distributed stochastic neighbor embedding.

