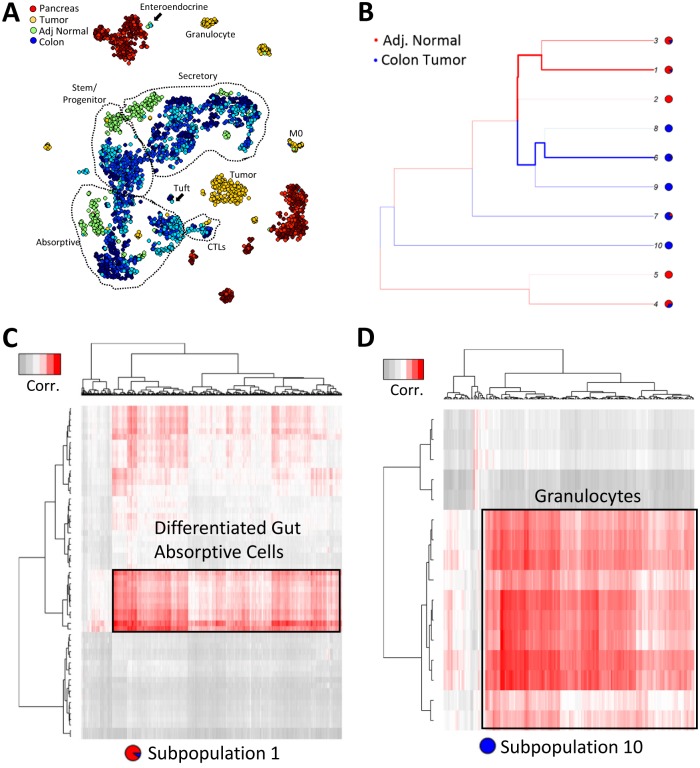
Fig 6. sc-UniFrac identifies unique cellular infiltrates within colonic tumor compared with normal colon.
(A) t-SNE plot of multiple replicates of single-cell data from the pancreas, colonic tumor, adjacent normal colon, and normal colon analyzed together. Random sampling of 400 cells from each group. Populations delineated by marker genes. (B) Branching structure of tumor and adjacent normal landscapes scored by sc-UniFrac (k = 10). (C, D) Individual cells (columns) from subpopulations 1 (C) and 10 (D) of panel B being matched to cell types (rows) referenced from the Mouse Cell Atlas. Analysis similar to Fig 5. Data from GSE117615. t-SNE, t-distributed stochastic neighbor embedding.

