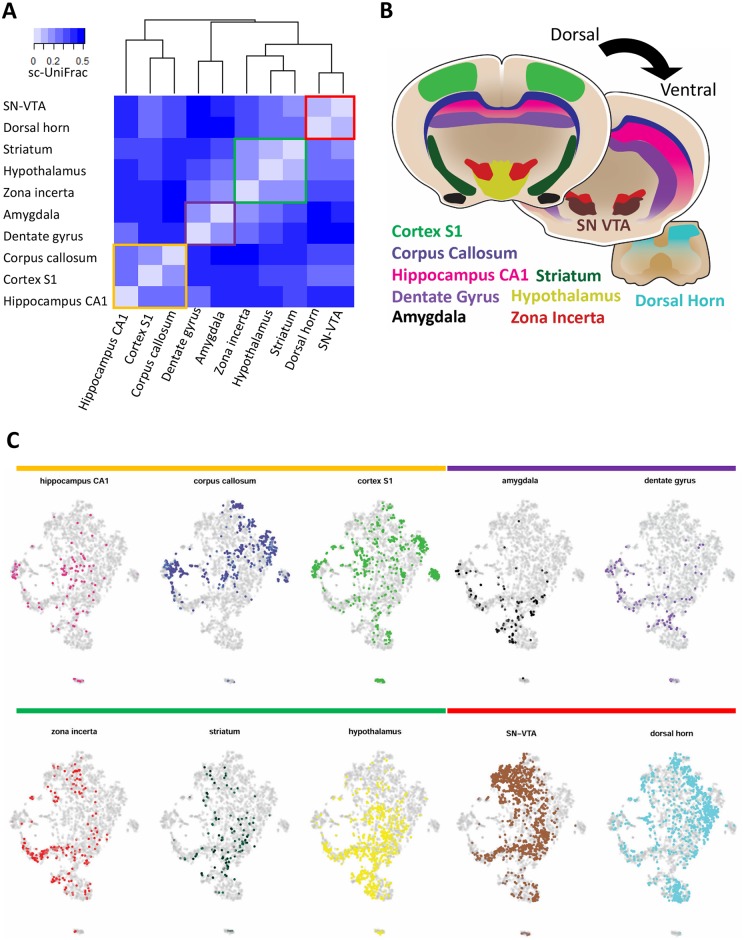
Fig 7. sc-UniFrac groups oligodendrocytes by brain regions.
(A) Hierarchical clustering by sc-UniFrac of scRNA-seq data generated from different regions of the brain according to [29]. Heat represents sc-UniFrac distance between two regions. (B) Schematic of brain regions for generating scRNA-seq data. (C) t-SNE plot of data combined from all brain regions, with oligodendrocytes from each region highlighted. Data from GSE75330. scRNA-seq, single-cell RNA sequencing; SN-VTA, substantia nigra and ventral tegmental area; t-SNE, t-distributed stochastic neighbor embedding.

