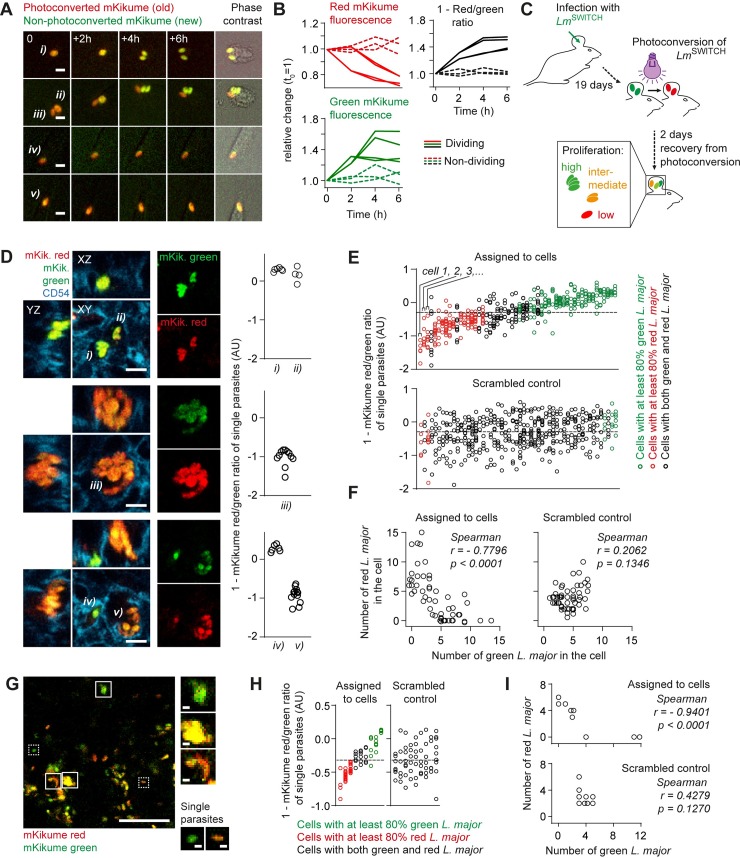
Fig 1. Photoconversion-based proliferation measurements show cell-intrinsic control of L. major proliferation rates in vivo.
(A) Peritoneal macrophages infected with LmSWITCH in vitro, photoconverted and imaged over time. i, ii, parasites undergoing cell division in the course of the movie, iii, iv, v, non-dividing parasites. Scale bar, 5 μm. (B) Quantification of relative changes of mKikume red and green fluorescence, and 1 –red/green ratio from parasites i) through v) from (A). Each line represents one parasite; solid lines, parasites which undergo division in the course of the movie; dashed line, non-dividing parasites. (C) Experimental setup for in vivo L. major proliferation measurement using LmSWITCH. (D) Immunofluorescence analysis of LmSWITCH infected C57BL/6 mouse ears photoconverted as shown in (C). Tissues were stained anti-CD54 to mark cell outlines, and red/green ratios of the individual parasites within the cells (i-v) were determined (graphs, each symbol represents one parasite segmented manually from at least 3 different Z slices of the stack shown on the left). Scale bar, 5 μm. Values represented as 1 –red/green fluorescence ratio. (E) Quantification of single parasite red/green ratios (one symbol per parasite) infecting individual cells (one cell is represented in each column), ordered according to the mean red/green fluorescence ratio of parasites in the respective column (upper panel and scrambled control with individual parasites assigned randomly to the cells (lower panel). Red symbols, >80% parasites below the overall mean, green symbols, >80% parasites above the overall mean. The overall mean is represented by a dotted line. Values represented as 1 –red/green fluorescence ratio. (F) Left panel, number of LmSWITCH which are mainly red within a single cell plotted against the number of mainly green LmSWITCH within the same cell. Right panel, scrambled control as described in (E). Each symbol represents one infected cell analysed. (G) Intravital 2-photon analysis of LmSWITCH infected C57BL/6 mouse ears that were photoconverted as shown in (C). Solid boxes, groups of more than 5 parasite-sized signals localized closely enough to be in the same host cell, dotted boxes, individual (less than 3) parasites. Scale bars, 50 μm (large image), 3 μm (insets). (H-I) Analysis of mKikume red/green ratio of LmSWITCH within individual parasite clusters as described in (E-F). Examples representative of >5 animals imaged.

