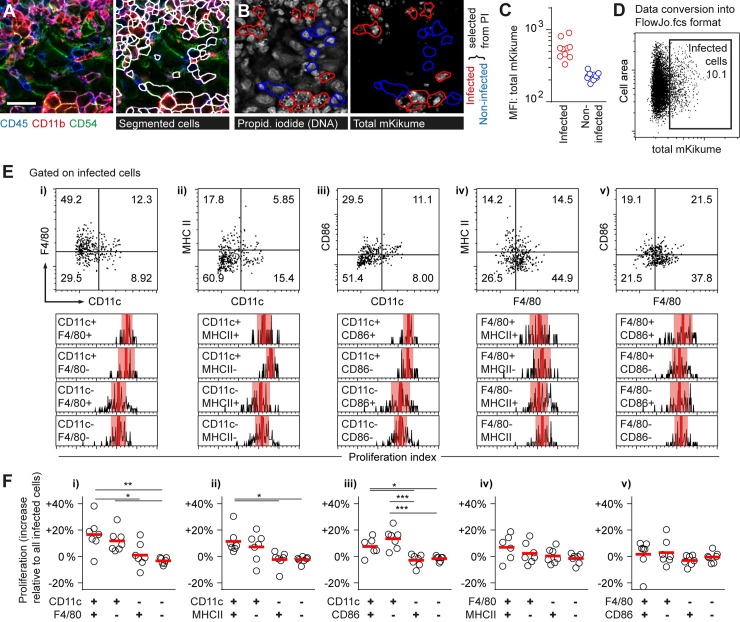
Fig 2. CD11c defines a phagocyte subset harboring highly proliferative L. major.
(A-F) LmSWITCH-infected ears were photoconverted 3 weeks post infection and analyzed 48h later via MELC [34]. (A) Automated cell segmentation using the RACE software [35] based on CD45, CD54 and CD11b signals. Scale bar, 20 μm. (B-C) Examples (B) and quantification (C) of infected cells (red outlines and symbols) and non-infected cells (blue outlines and symbols) identified manually by propidium iodide staining of the small parasite nuclei. (D) Conversion to FlowJo.fcs format allows for gating on infected cells according to the threshold defined in (C), see also S1 Fig (E) Top row: Infected cells subdivided according to CD11c versus F4/80, MHC II or CD86 expression (i, ii, iii) and F4/80 versus MHC II and CD86 (iv, v). Bottom row: Relative proliferation rates of LmSWITCH (obtained by normalization of the subpopulation’s proliferation indices to the overall mean proliferation index within each sample) in the respective subpopulations. Vertical bars denote the mean; shaded red boxes, standard deviation. (F) Quantification of 7 individual MELC experiments performed in 4 different infected mice according to the populations defined in (E), i though v. Each symbol represents one imaged infection site. Horizontal bars represent the mean. ***p < 0.001; **p < 0.01; *p < 0.05. Vertical bars denote the mean.

