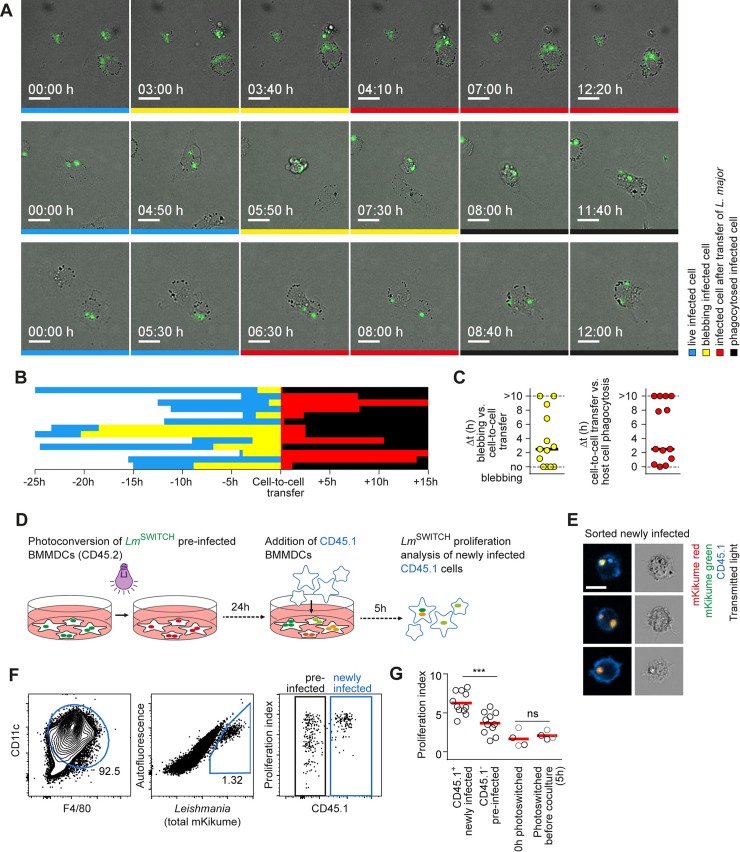
Fig 6. High proliferating L. major preferentially undergo cell-to-cell transmission.
(A-C) Time lapse videomicroscopy of intraperitoneal macrophages infected for 24 h with fluorescently labeled L. major. (A) Three examples of cell-to-cell transfer between two phagocytes. Selected frames of a time series spaced 10 min are shown. Frames in which the originally infected cell is still alive and motile are marked blue, frames showing the original phagocyte with signs of cell death before transfer of the parasite are marked in yellow, after transfer in red. Complete phagocytosis of the original host cell is marked black. Scale bar, 10 μm. (B) Analysis of the sequence of host cell death, parasite transfer and phagocytosis of the original host cell from 13 cell-to-cell transfer events analysed, using the colour code indicated in (A). (C) Quantification of the time between the first blebbing as a sign of cell death and cell to cell transfer (left) and the time between cell-to-cell transfer and complete phagocytosis of the original host cell. Horizontal bars denote the median. (D-G) Quantitative in vitro analysis of parasite cell-to-cell transfer in mixed of bone marrow-derived macrophages and dendritic cells (BMMDCs). (D) Experimental setup for in vitro cell-to-cell transfer analysis. (E) Confocal microscopy of sorted CD45.1+ infected cells (newly infected) showing intracellular localization of fluorescent L. major. Images are representative of > 20 cells inspected microscopically. Scale bar, 10 μm. (F) Gating strategy to identify newly infected (CD45.1+) and preinfected (CD45.1-) BMMDCs. (G) Quantification of proliferation rates in newly infected (CD45.1+) and preinfected (CD45.1-) cells analysed as shown in (A) (left), and controls photoconverted 0h and 5h before analysis to assess the recovery from photoconversion occurring in the 5h of coculture (right) in newly infected (black symbols) and preinfected (grey symbols) cells. Each symbol shows one individual experimental replicate. Data were pooled from three independent experiments. Horizontal bars denote the mean. ***p < 0.001; ns, not significant.

