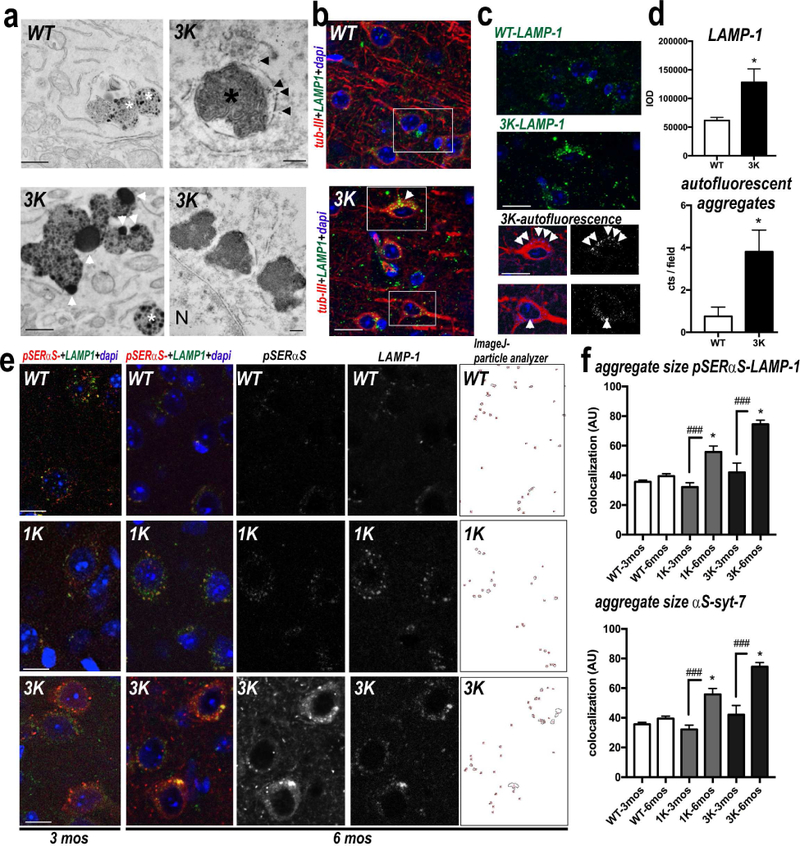
Figure 6.

Abnormal αS accumulation at large perikaryal vesicles in motor cortex of 3K mice. (a) EM reveals large lipid-rich lipofuscin-like deposits (white arrowheads) in neurons of 6 mo old 3K (but not WT) brain. The deposits tended to occur near multivesicular bodies (white asterisks), were often single membrane bound (black arrowheads) and occasionally contained lamellar membrane whorls typical of late endosomes/lysosomes (black asterisk) and close to the nucleus (N). (b) Confocal microscopy (merged images) of brain sections triple-labeled for β-III tubulin (red), LAMP-1 (green) and nuclei (DAPI, blue). (c) Spectrally unmixed images of boxes from the merged images are enlarged to show overlap of LAMP-1 and autofluorescence in β-III positive neurons. (d): Quant. LAMP-1 reactivity and autofluorescent deposits in cortical neurons of 6 mo 3K vs. WT mice (n=10 fields each of brain sections of n=3 mice per genotype). (e) Confocal microscopy of cortical brain sections labeled for pSer129-αS (red) and LAMP-1 (green) as indicated. Far right: colocalized points were analyzed using Image J colocalization highlighter and particle analyzer plugin and (f) quant. (n= 3 mice per genotype at 3 and 6 mo). Adjacent brain sections labeled for hu (15G7) αS and syt-7 (Fig. S4) were quantified for co-localized aggregate sizes in n=10 fields each of sections from each genotype. Note significant age-dependent increases in 1K and 3K but not in the age-and (αS)-matched WT mice. Means ± SEM. *p<0.05, **p<0.01, (d: unpaired 2-tailed Student’s t test; f: one-way ANOVA post Tukey. Scale bars: (a) 1 µm, (b) 25 µm, (c, e) 20 µm.
