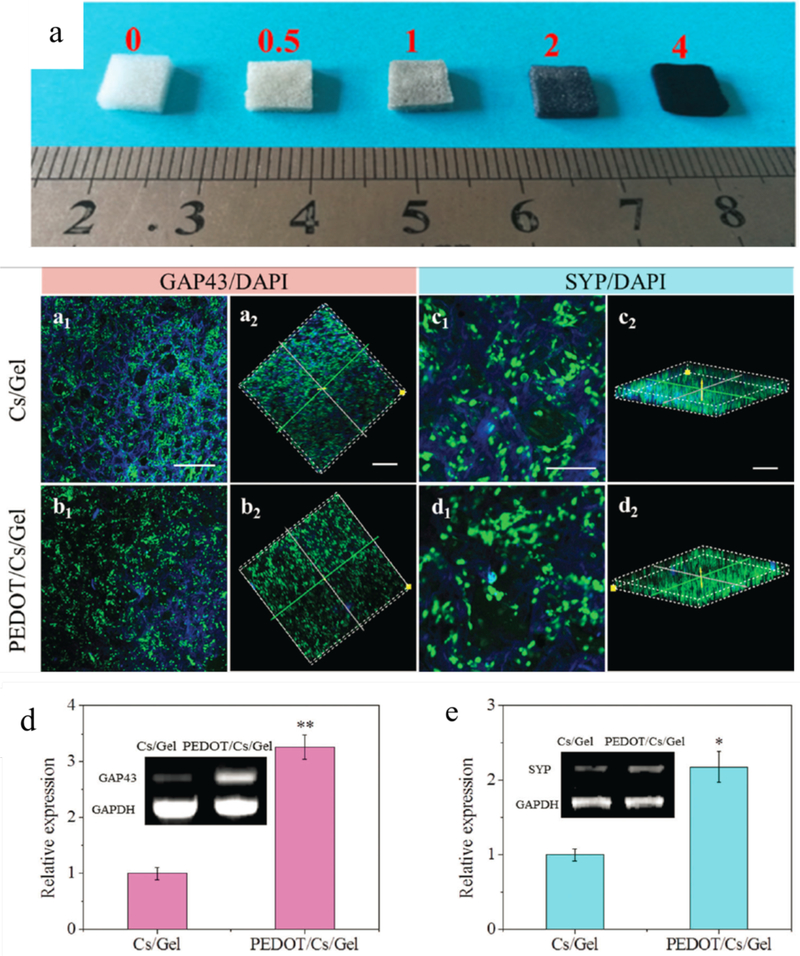
Figure 10.
(a) Images of the polymerized PEDOT/chitosan/gelatin (PEDOT/Cs/Gel) scaffolds with different molar ratios of ammonium persulfate (APS) to EDOT. Neurite growth protein (a1-d2) and gene expression of PC12 cells (d, e) in the scaffolds after 5 days of culture. 2D and 3D confocal fluorescence micrographs of immunostained cells on the chitosan/gelatin (Cs/Gel) scaffold (a and c) and the PEDOT/Cs/Gel scaffold (b and d). GAP43 and SYP are shown in green, and the nuclei are stained in blue (DAPI). (a, b, c2 and d2) scale bar = 500 mm, (c1 and d1) scale bar = 200 mm. qPCR analysis of the gene expression levels of GAP43 (d) and SYP (e) on the Cs/Gel and PEDOT/Cs/Gel scaffold. *P<0.05, **P<0.01 are statistically different from the Cs/Gel control group. Reproduced from reference 135 with permission of The Royal Society of Chemistry. http://dx.doi.org/10.1039/C7TB00608J

