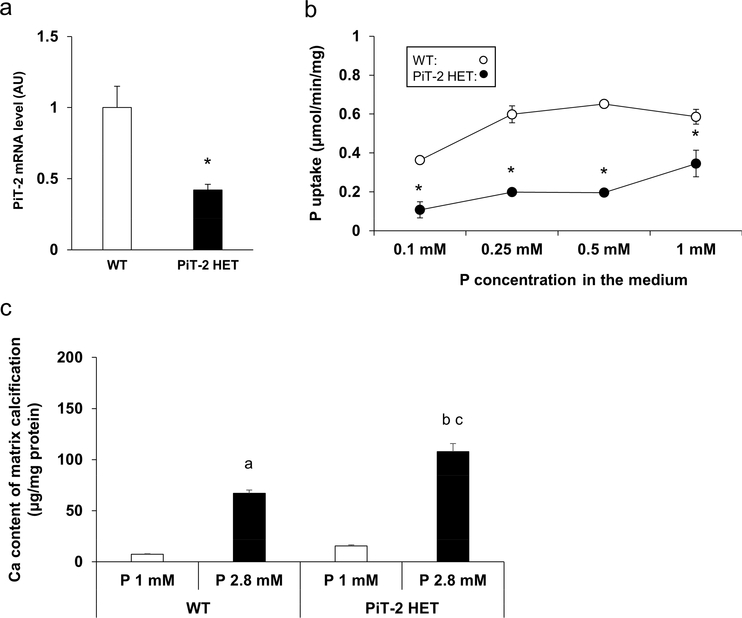
Figure 8 |. Effects of PiT-2 haploinsufficiency on cultured VSMCs.
(a) PiT-2 mRNA level. (b) Na-dependent P uptake rate. (c) Quantification of matrix calcification in the primary cultured VSMCs derived from either WT or PiT-2 HET mice. Data are expressed as mean ± SEM (n=3) and compared by un-paired t-test or one-way ANOVA followed by Tukey–Kramer test. A two-tailed P<0.05 was considered statically significant. *P<0.05 versus WT group. aP<0.05 versus WT-derived VSMCs treated with 1 mM P medium. bP<0.05 versus WT-derived VSMCs treated with 2.8% P medium. cP<0.05 versus PiT-2 HET-derived VSMCs treated with 1% P medium. Ca, calcium; Na, sodium; OPG, osteoprotegerin; P, phosphate; PiT-2 HET; PiT-2 heterozygous knockout; siRNA, small interfering RNA; VSMCs, vascular smooth muscle cells; WT, wild-type.

