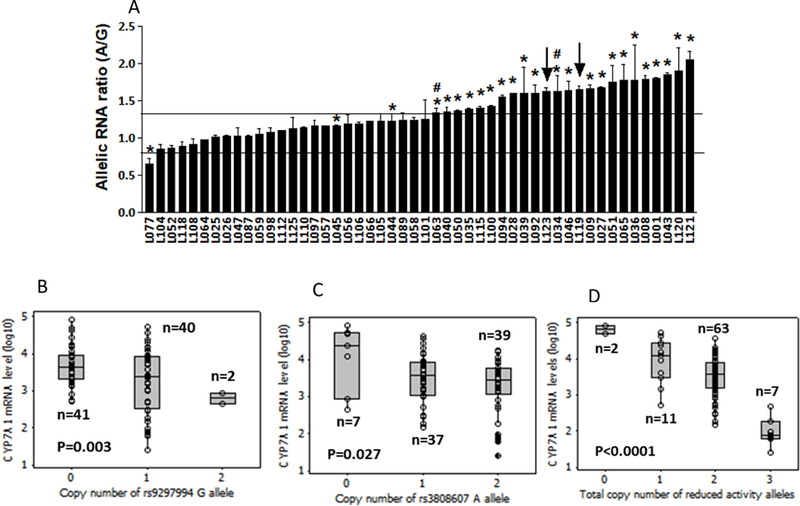
Figure 3.

Panel a. Allelic CYP7A1 mRNA expression ratios in human livers measured with a primer extension assay (SNaPshot) using rs8192879 as marker. Allelic RNA ratios are normalized to genomic DNA ratios = 1. Data represent the mean of three measurements (± SD). The star marks 25 livers heterozygous for rs9297994 and rs3808607, # plus * marks two AEI-positive samples heterozygous only for rs9297994, and arrows indicate two AEI-positive samples homozygous for both rs9297994 and rs3808607. Horizontal lines indicate 1.3-fold AEI-cut-off ratios. Panel b-d. CYP7A1 mRNA levels in the liver (log10-scale) grouped by number of reduced activity alleles of (b) rs9297994, (c) rs3808607, or (d) sum of rs9297994 and rs3808607. Statistical analyses were performed using multiple linear regression model. Box and horizontal lines: 25th-75th percentiles and mean, whiskers: minimum and maximum values, circles: individual values.
