
Figure. PHACTR1 and EDN1 gene expression in vascular tissues and cells.
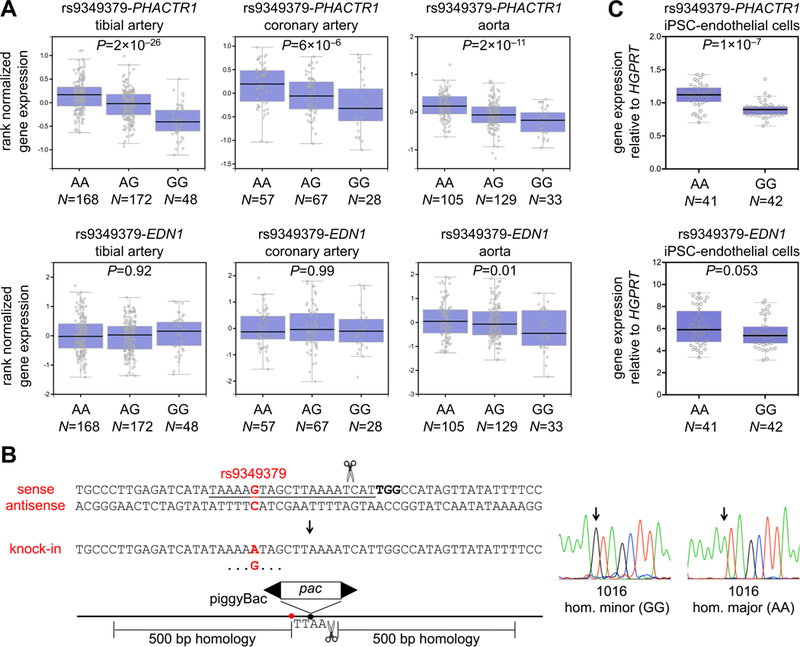
(A) Gene expression in three human vascular tissue types stratified by rs9349379 genotype. The Tukey box plots were generated by the Genotype-Tissue Expression Project portal (https://www.gtexportal.org/). (B) Homozygous knock-in of the rs9349379 major allele (A) or minor allele (G) using CRISPR-Cas9 and a targeting vector with puromycin resistance encoded within a scarless-excision piggyBac transposon. The protospacer is underlined, the protospacer-adjacent motif is bolded, and the position of rs9349379 is indicated in red. Sanger sequencing electropherograms of successfully targeted clones are shown. (C) Gene expression in isogenic rs9349379 homozygous major (AA) and homozygous minor (GG) human induced pluripotent stem cell (iPSC)-derived endothelial cells. Expression levels relative to HGPRT (reference gene) were quantified by the 2−ΔΔCt method. Data are displayed as Tukey box plots with all individual data points shown. P-values were calculated with Mann-Whitney U tests.