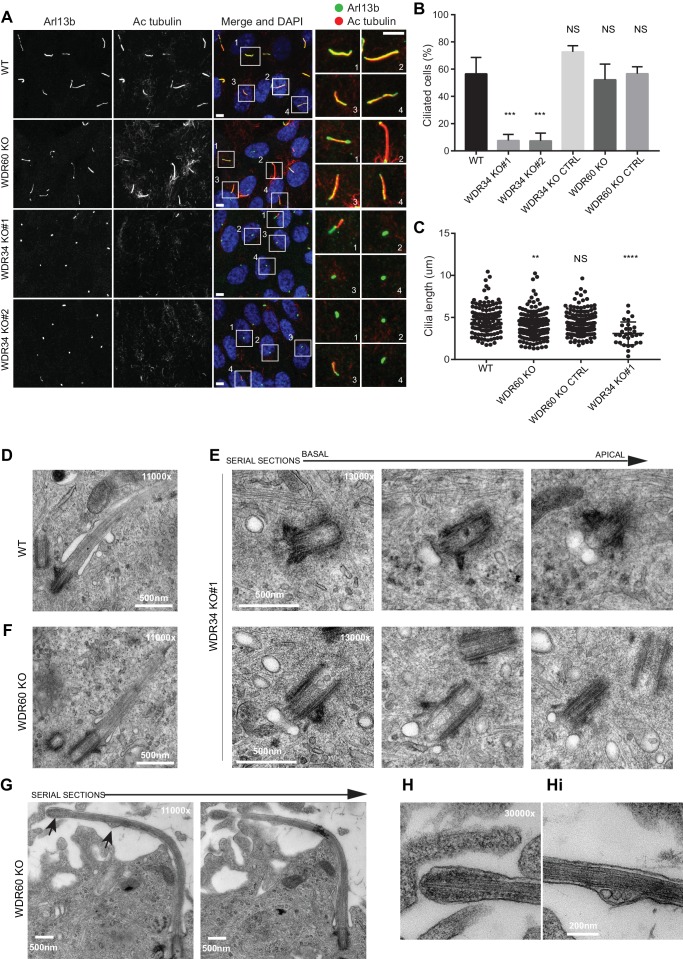
Figure 1. Role of dynein-2 intermediate chains WDR34 and WDR60 in ciliogenesis.
(A) Cilia stained with the markers Arl13b (green) and acetylated tubulin (AcTub, red) in RPE1 WDR60 and WDR34 KO cell lines. Panels on the right show enlargements of the boxed regions. Scale bars 5 μm. (B) Percentage of ciliated cells (n = 3; 656 WT, 430 WDR34 KO#1, 296 WDR34 KO#2, 397 WDR34 KO CTRL, 343 WDR60 KO and 195 WDR60 KO CTRL cells quantified). (C) Cilium length in WDR60 and WDR34 KO compared with WT cells and CRISPR control cells lines (n = 3; 120 WT, 158 WDR60 KO, 138 WDR60 KO CTRL and 30 WDR34#1 cells quantified). Mann-Whitney test was used, p-value: ****=<0.0001. (D–Hi) Representative 70 nm thick EM sections of (D) WT, (E) WDR34 KO and (F, G– Hi) WDR60 KO cilia. (E) Six serial sections through a WDR34 KO cilium showing no axoneme extension. (G) Two serial sections through a WDR60 KO cilium showing complete cilium. Arrows point to the bulbous ciliary tip and to a membrane protrusion containing membrane vesicles; enlargements are shown to the right (H and Hi). Scale bar length and magnification is indicated on the images.


