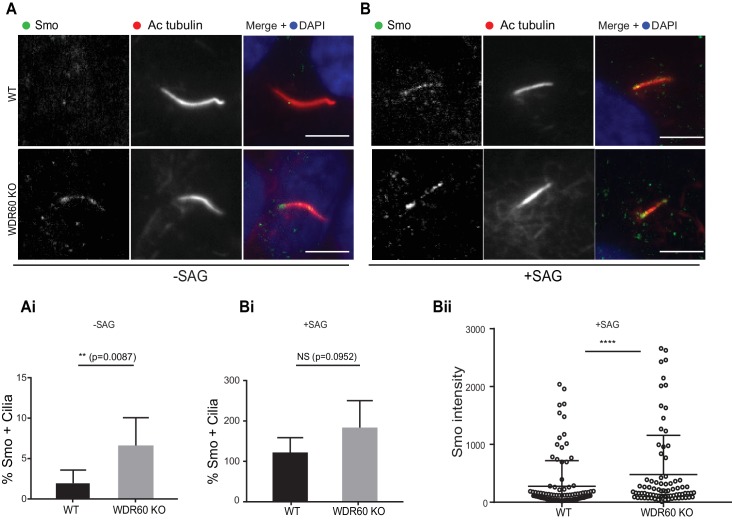
Figure 6. Loss of WDR60 affects Smo localization in the cilia.
(A and B) Immunofluorescence of WT and WDR60 KO cells in presence or absence of SAG and stained for Smo (green), AcTub (red), and DAPI (blue). (Ai and Bi) Percentage of Smo positive cilia in SAG untreated (n = 3, 148 WT and 120 WDR60 KO cells quantified) and treated cells (n = 3, 670 WT and 580 WDR60 KO cells quantified). (Bii) Quantification of the total intensity of ciliary Smo labeling in cells treated with SAG (n = 3, 102 WT and 82 WDR60 KO cells quantified). Mann-Whitney test was used, p-value: ****=<0.0001. Scale bars 5 μm.

