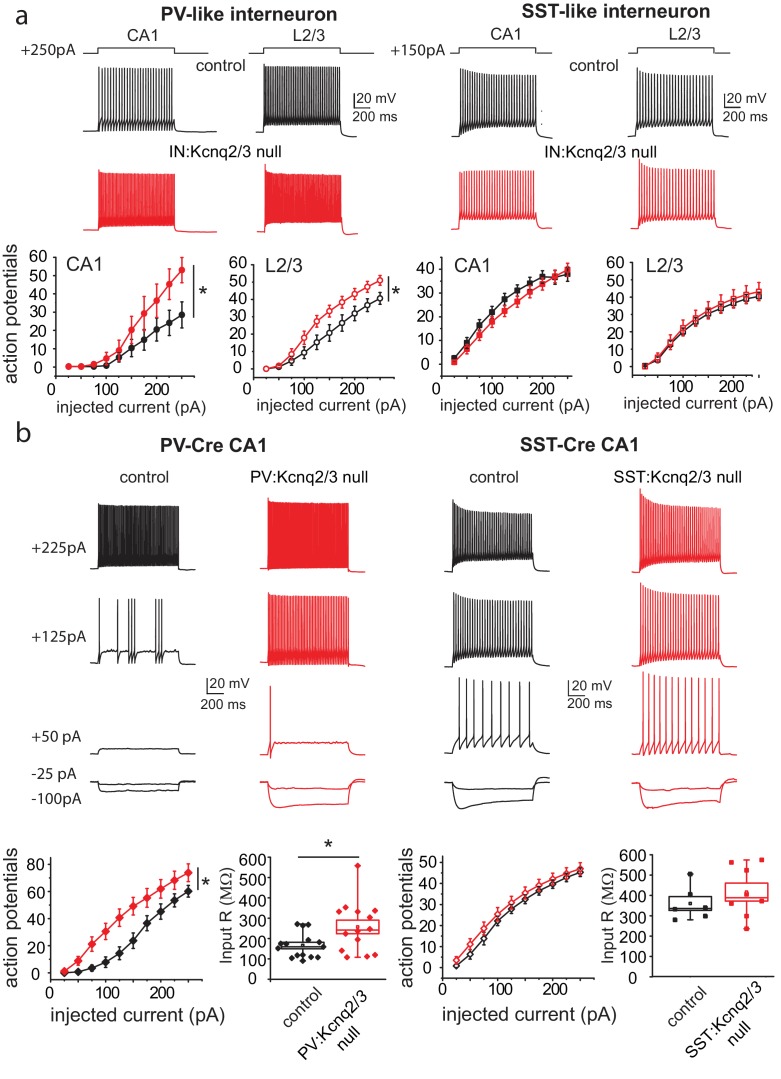
Figure 2. Loss of KCNQ2/3 activity leads to increased excitability of PV+interneurons.
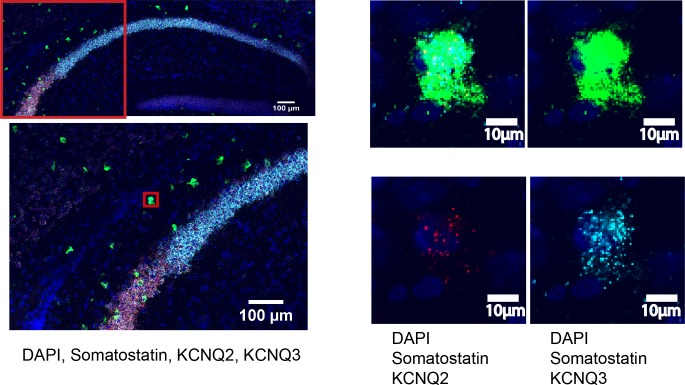
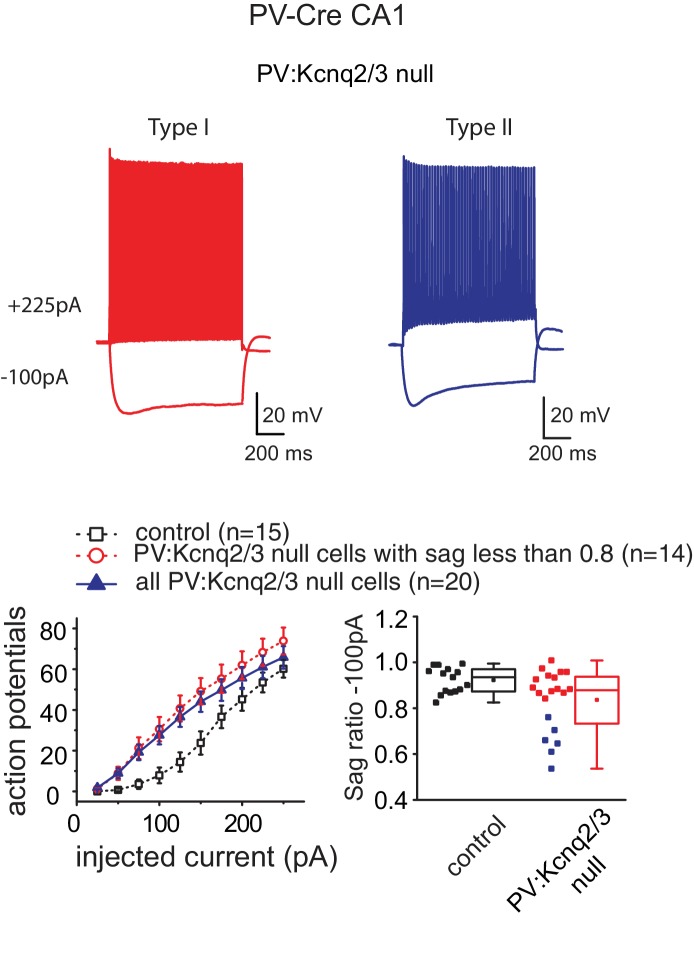
(a) Top, representative voltage responses from a +150 pA current injection step (1 s) in PV- and SST-like interneurons in either the CA1 region of the hippocampus (P12–P17) or L2/3 of the somatosensory cortex (P8–P11). For L2/3 recordings, cells were also confirmed by immunoreactivity against SST antibodies. Bottom, summary graphs showing the effect of deleting KCNQ2 and KCNQ3 channels on action potential number from CA1 PV-like (control n = 8/6; IN:Kcnq2/3 null n = 8/5), SST-like (control n = 19/8; IN:Kcnq2/3 null n = 8/4), and L2/3 (PV-like: control n = 10/7; IN:Kcnq2/3 null n = 8/4; SST-like: control n = 10/6; IN:Kcnq2/3 null n = 5/4) interneurons (Vh=-75 to −77 mV). For CA1 PV-like cells (P16–P25), F(9,126)=2.849, p=0.0043; for L2/3 PV-like cells, F(9,144)=3.845, p=0.0002); for CA1 SST-like cells (P15–P19), F(9,225)=0.601, p=0.7955; and for L2/3 SST-like cells, F(9,117)=0.326, p=0.965. Significance was determined using a two-factor mixed ANOVA. See Figure 2—figure supplement 1 showing that indeed SST cells express KCNQ2 and KCNQ3 mRNA. (b) Top, representative voltage responses to a series of current injection steps (1 s) in PV+ and SST+ interneurons in the CA1 region of the hippocampus (Vh=-75 to −77 mV). Bottom left, summary graph showing the effect of deleting KCNQ2 and KCNQ3 channels on action potential number from CA1 PV+ cells (control n = 15/8; PV:Kcnq2/3 null n = 14/7; F(9,243)=3.558 with p=0.0004). Middle left, summary graph showing that loss of KCNQ2/3 channels decreases PV+ input resistance (control, n = 15/8; PV:Kcnq2/3 null, n = 14/7; df = 27 t=−2.54 p=0.017 unpaired Student’s t-test). See also Figure 2—figure supplement 2 regarding PV+ Kcnq2/3 null neurons diversity of intrinsic properties. Middle right, summary graph showing the effect of deleting KCNQ2 and KCNQ3 channels on action potential number from CA1 SST+ cells (control n = 6/2; SST:Kcnq2/3 null n = 8/4; F(9,108)=0.729 with p=0.6814). Bottom right, summary graph showing loss of KCNQ2/3 channels did not decrease SST+ input resistance (control n = 6/2; SST:Kcnq2/3 null, n = 8/4; df = 12 t=−0.42 p=0.68 unpaired Student’s t-test). ‘n’ designates number of cells followed by number of animals. Each data point represents recording from one neuron. Data in summary graphs are represented as mean and s.e.m.


