
Figure 5. RNA-sequencing reveals cellular functions that are regulated during glucose and the lag phase.
(A) Experimental set-up of the RNA-Seq experiment. The wild-type strain adapted to maltose growth was transferred to glucose for different times (0, 2, 4, 6, 8, 10, 12 hr) before switching it back to maltose. Multiple samples (indicated by stars) were taken during the different growth phases. The final sample was taken when the cultures increased 4-fold after the shift to maltose. (B) Heatmap representing a selection of non-redundant GO categories that were significantly enriched in the set of up- or downregulated genes of at least three samples throughout the experiment (Materials and Methods). The heatmap displays the GO category on the horizontal axis, the sample on the vertical axis, while the color scale indicates enrichment of the GO category. The clustering by rows reveals groups of related GO categories which are indicated on the right in grey boxes.

Figure 5—figure supplement 1. Detection of genes that show large transcriptional changes between 1 hr and 12 hr after the shift to glucose.
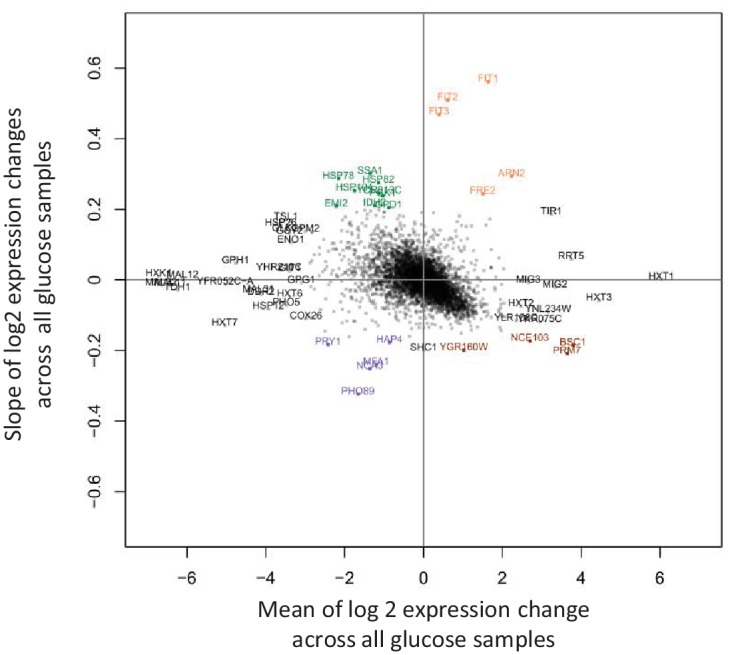
Figure 5—figure supplement 2. Log2 expression changes during glucose growth for the genes that show large transcriptional changes between 1 hr and 12 hr after the shift to glucose Log2 expression of the genes highlighted in Figure 5—figure supplement 1 is shown between 1 hr and 12 hr after the shift to glucose.
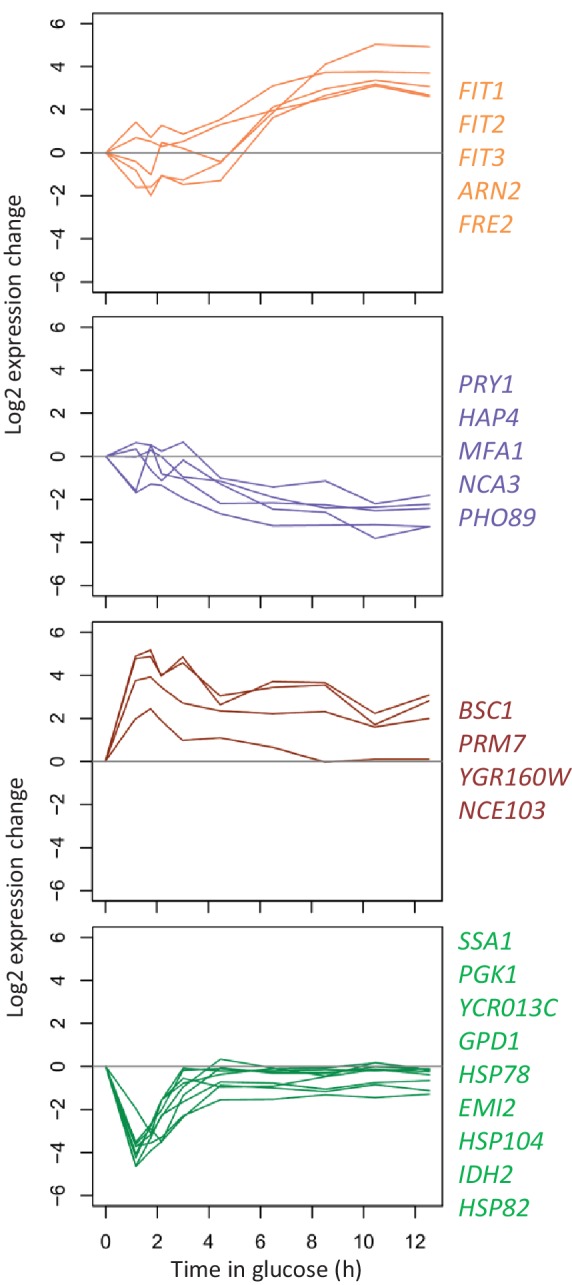
Figure 5—figure supplement 3. Correlation between the lag behavior upon gene deletion (Bar-Seq), and the expression change of the corresponding genes during glucose growth (RNA-Seq).
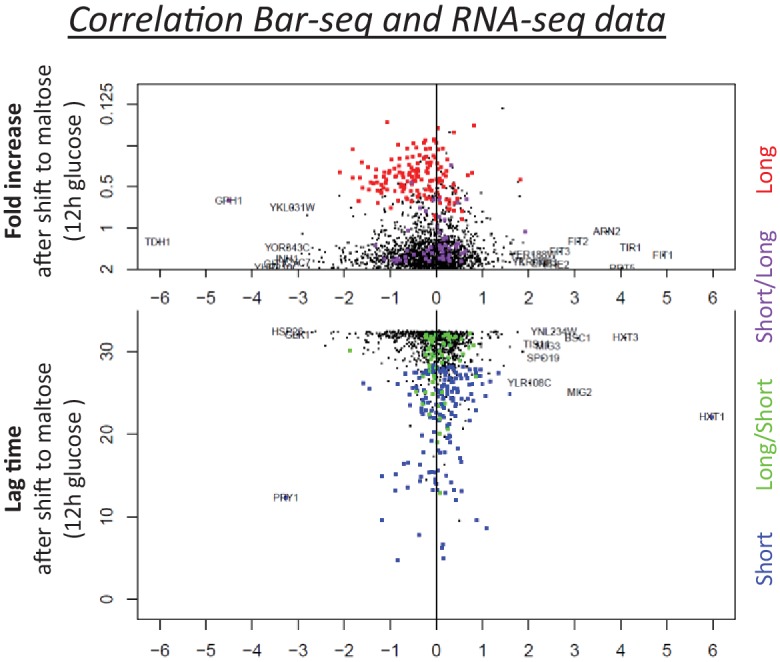
Figure 5—figure supplement 4. Correlation between protein and mRNA level changes during glucose growth after pre-growth on maltose.
