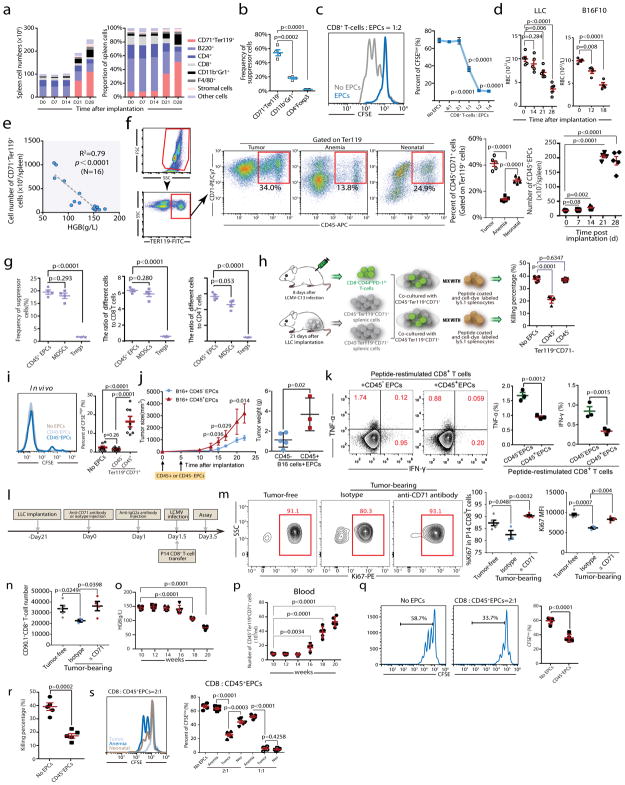
Fig. 2. CD45+CD71+TER119+erythroid progenitor cells accumulate in tumor-bearing mice and exert immunosuppressive effects on CD8+T cells.
a, The number (left) and frequency (right) of MDSCs (CD11b+Gr1+), erythroid progenitor cells (CD71+TER119+), stromal cells (CD45−TER119−), macrophages (F4/80+), CD4+T, CD8+T and B (B220+) cells in the spleens of C57BL/6 mice were quantified at different time points (0, 7, 14, 21 and 28 days) after LLC cell inoculation (n=4). b, The frequencies of MDSCs, CD71+TER119+ cells and Tregs in the spleen 28 days after LLC inoculation were determined (n=4). c, Representative flow cytometry (left) and cumulative composite data (right) showing the proliferation of CFSE-labeled CD8+ T cells after co-culture with CD71+TER119+erythroid progenitor cells isolated from the spleens of tumor-bearing mice at different CD8+ T cell: erythroid progenitor cell ratios (n=4). d, Mature red blood cell (RBC) counts were measured in tumor-bearing mice at different time points (n=4 or 5) after LLC or B16F10 inoculation. Each point represents data from an individual mouse, and the data are representative of at least three independent experiments. e, The correlation between the total number of CD71+TER119+ erythroid progenitor cells in the spleens of tumor-bearing mice and hemoglobin (HGB) concentration was analyzed by Pearson’s correlation coefficient. (n=16). f, Gating strategy: after excluding doublets or larger aggregates, DAPI-positive cells, which are likely membrane-permeable apoptotic cells, were excluded from further analysis. Next, very small events, likely nuclei or debris, were excluded. Finally, we selected TER119+ cells for further analysis. Representative flow cytometry and cumulative composite data show the frequency of CD45+CD71+ cells within the TER119+ population in the spleens of tumor-bearing (21d), anemic(4d) and neonatal mice. Right panel: cumulative composite data show the total number of CD45+CD71+TER119+ cells in the spleens of tumor-bearing mice at the indicated days after tumor inoculation (n=5). g, Cumulative composite data show the frequencies of CD45+CD71+TER119+ EPCs, MDSCs and Tregs in the spleen of mice with advanced tumors (28 days after LLC inoculation)(left). The ratio of immunosuppressive cells, CD45+CD71+TER119+ EPCs, MDSCs or Treg cells, against CD8+(middle) or CD4+(right) T cells in the spleen of mice with advanced tumors (28 days after LLC inoculation) (n=4).
h, CD45+CD71+TER119+ or CD45−CD71+TER119+erythroid progenitor cells isolated from the spleens of tumor-bearing mice were co-cultured with sorted CD8+T cells and the T cell ex vivo killing efficiency was determined after 6 h (n=5). i,2×105 CFSE-labeled P14 CD8+ T cells were mixed with 2×10⁶ sorted CD45+CD71+TER119+ or CD45−CD71+TER119+ cells. The mixed cells were then adoptively transferred into naïve B6 mice immediately (n=8), which were subsequently infected with LCMV-Armstrong. These mice were sacrificed on day 3 post infection and CFSEhigh CD8+ T cells were analyzed by flow cytometry. j–k, A total of 2×10⁵ B16F10-Ova melanoma cells were subcutaneously injected into C57BL/6 mice on day 0. Next, 2×10⁶ CD45+CD71+TER119+ or CD45−CD71+TER119+ cells were intravenously injected on days 0 and 5. j, Tumor growth was monitored every 2 or 3 days (left). Mice were sacrificed on day 22and tumors were collected and weighed (right). Each point represents data from an individual mouse (CD45+CD71+TER119+ group n=3, CD45−CD71+TER119+ group n=5), and data were analyzed by two-tailed unpaired t-test. k, Tumor infiltrating leukocytes were enriched and loaded with the OVA257–264 (SIINFEKL) peptide in vitro for 24-hour restimulation. Frequencies of IFN-γ and TNF-α producing T cells were analyzed by intracellular cytokine staining. Each point represents data from an individual mouse (n=3), and data were analyzed by two-tailed unpaired t-test. l–n, A total of 1×10⁶ Lewis lung cancer cells were subcutaneously injected into C57BL/6 mice (PBS was used as control). Anti-CD71 antibody (1 mg/mouse) was intravenously injected at day 21 after tumor cell inoculation (IgG was used as control, 1 mg/mouse). To attenuate the anti-CD71 antibody, anti-IgG2a antibody (3 mg/mouse) was intravenously injected 24 h later. Finally, we adoptively transferred P14 CD8+ T cells (CD90.1, 2×10⁶ cells/mouse) into mice and infected with LCMV cl13 simultaneously 36 h after administration of anti-CD71 antibody. All mice were sacrificed at day 2 after LCMV infection (l). Representative flow cytometry (m, left) and cumulative composite data (m, middle) show the frequency of Ki67+ cells among P14 CD8+ T cells. Cumulative composite data show the Ki67 MFI in P14 CD8+ T cell (m, right). Cumulative composite data show the total number of CD90.1+CD8+ P14 cells in the spleen (n). o–q, The hemoglobin (HGB)concentration (o) and number of CD45+CD71+TER119+ cells (p) in the peripheral blood of MMTV-PyMT female mice which developed palpable mammary tumors at 12 weeks old were determined at the indicated weeks. The proliferative capacity of CFSE-labeled CD8+ T cells in response to anti-CD3 and anti-CD28 was analyzed after co-culture with CD45+CD71+TER119+ EPCs isolated from the spleens of 20 week old MMTV-PyMT female mice at a CD8+ T cell/EPC ratio of 1:2 (q); CD45+CD71+TER119+ EPCs isolated from spleens of 20 week old MMTV-PyMT females mice were co-cultured with sorted CD8+ T cells and the ex vivo T cell killing efficiency was determined after 6 h (r). s, The proliferative capacity of CFSE-labeled CD8+ T cells in response to anti-CD3 and anti-CD28 was analyzed after co-culture with CD45+CD71+TER119+ erythroid progenitor cells isolated from the spleens of tumor-bearing, anemic or neonatal mice at the indicated CD8+ T cell:EPC ratios (n=5). Each point in (b–e) and (h–m) represents data from an individual mouse. Data are representative of three independent experiments and were analyzed by two-tailed unpaired t-test. Two-tailed p-values were reported. Bar graphs denote mean values with SEM.

