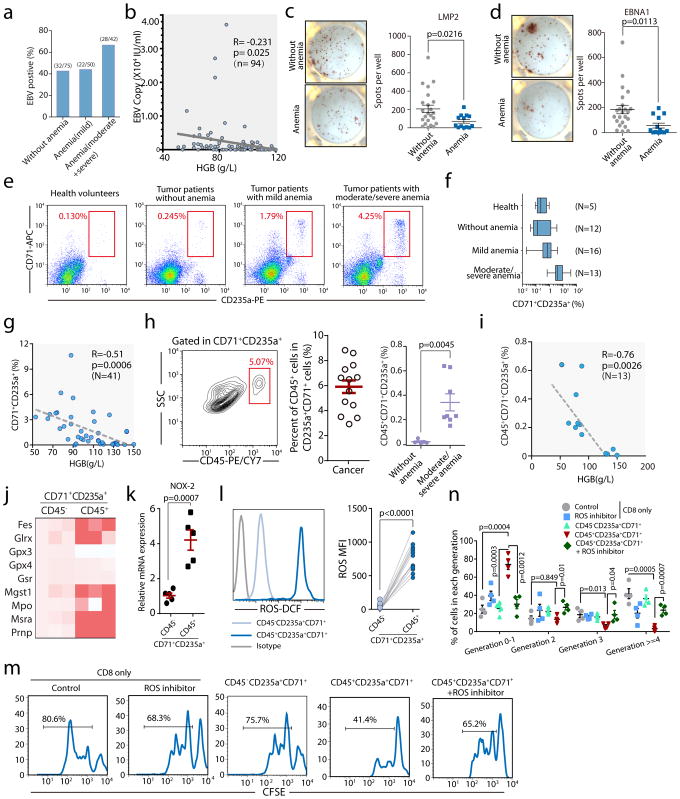
Fig. 4. Erythroid progenitor cells accumulate in cancer patients with anemia, and their inhibitory effects on CD8+T cells can be blocked by a ROS inhibitor.
a–b, EBV DNA loads in the peripheral blood were detected. The percentage of EBV positive patients (EBV DNA>400 copies/mL) without anemia (male: HGB>120 g/L, female: HGB>110 g/L) or with varying degrees of anemia (mild HGB>90 g/L, moderate HGB 60–90 g/L, severe HGB 30–60 g/L) is shown (a). The correlation between hemoglobin (HGB) and EBV DNA loads in the peripheral blood of cancer patients was analyzed by Pearson’s correlation coefficient (b, n=94). c–d, Enzyme-linked immunospot assay (ELISPOT) results show the number of LMP2(c) or EBNA1(d) specific CD8+ T cells in 1×10⁶ PBMCs in cancer patients without (HB>110 g/L, n=23) or with anemia (<110g/L, n=13). e–f, Representative flow cytometry plots (e) and cumulative composite data (f) showing the percentages of CD71+CD235a+erythroid progenitor cells in the peripheral blood of healthy donors and cancer patients without (HB>110 g/L) or with varying degrees of anemia. g, The correlation between hemoglobin (HGB) and the frequency of CD71+CD235a+erythroid progenitor cells in the peripheral blood of cancer patients was analyzed by Pearson’s correlation coefficient (n=41). h, Representative flow cytometry plots and cumulative composite data showing the frequency of CD45+ cells in CD71+CD235a+ cells in the peripheral blood of cancer patients with or without anemia (n=13). Far right panel: frequency of CD45+CD71+TER119+ cells among PBMCs isolated from tumor patients without anemia (n=5) or with moderate and severe anemia (n=8). i, The correlation between hemoglobin (HGB) and the frequency of CD45+CD71+CD235a+erythroid progenitor cells in the peripheral blood of cancer patients was analyzed by Pearson’s correlation coefficient (n=13). j, mRNA expression levels of genes in the ROS pathway in CD45+CD71+CD235a+ and CD45−CD71+CD235a+ cells from the peripheral blood of cancer patients were quantified by RT-qPCR. k, Cybb (Nox2) mRNA expression in CD45+CD71+CD235a+ and CD45−CD71+CD235a+ cells from cancer patients was quantified by RT-qPCR (n=5). l, ROS production in CD45+CD71+CD235a+ and CD45−CD71+CD235a+ cells from cancer patients was analyzed by flow cytometry (left), and the mean fluorescent intensity (MFI)of the fluorescent dye for detecting ROS was quantified (right) (n=11). m–n, CD8+ T cell proliferation after stimulation with anti-CD3 and anti-CD28 was measured using CFSE-labeled CD8+ T cells cultured alone or co-cultured with CD45+CD71+CD235a+or CD45−CD71+CD235a+cells at a 1:1 ratio, with or without the ROS inhibitor apocynin. Representative FACS plat was shown in (m). Two-tailed unpaired t-test of four independent experiments was performed by measuring the distribution of CD8+ T cells in each division(n). Each point in (b–d) and (g–i) represents data from an individual patient. Data are representative of three independent experiments and were analyzed by a two-tailed unpaired t-test. Two-tailed p-values were reported. Error bars denote the SEM.

