Figure 1.

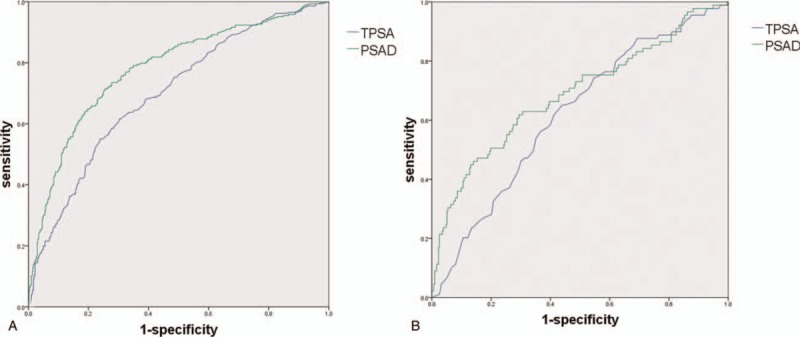
A. ROC curve analysis of PSA and PSAD in all 831 patients. B. ROC curve analysis of PSA and PSAD in patients with PSA 4 to 10ng/mL. PSA = prostate specific antigen, ROC = receiver operating characteristic.

A. ROC curve analysis of PSA and PSAD in all 831 patients. B. ROC curve analysis of PSA and PSAD in patients with PSA 4 to 10ng/mL. PSA = prostate specific antigen, ROC = receiver operating characteristic.