Figure 2.
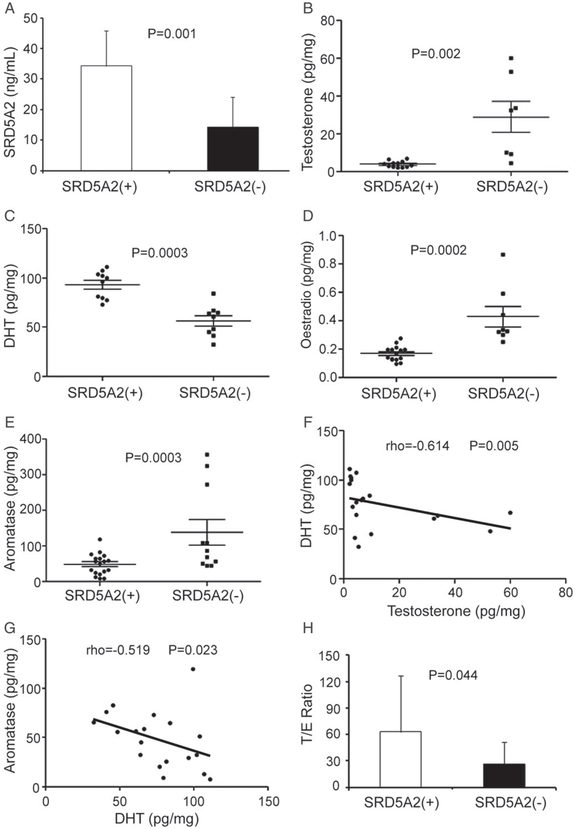
Androgen, oestrogen and aromatase levels in BPH prostatic samples. (A) SRD5A2 level, measured with ELISA. (B–D) Levels of testosterone (B), DHT (C) and oestradiol (D), measured by HPLC-MS. (E) Aromatase level, measured with ELISA. (F) DHT levels are negatively correlated with testosterone levels. (G) Aromatase levels are negatively correlated with DHT levels. (H) T/E ratio. Continuous variables were assessed with the Wilcoxon rank sum test. The association between two different parameters was assessed with Spearman rank correlation. The data in (A) and (H) represent means of average determinants ± standard error of the mean.

