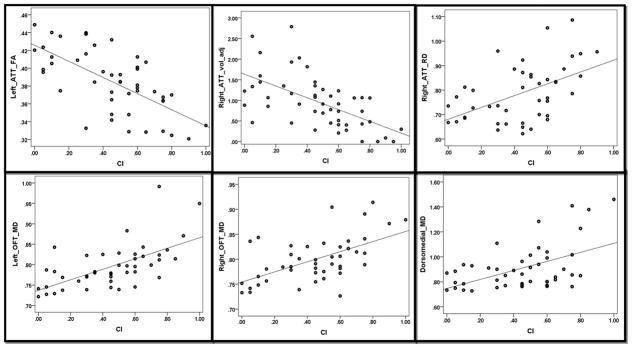
Figure 2.
Highlights of scatter plots of cognitive impairment index and fractional anisotropy, mean and radial diffusivities and adjusted volumes of orbitofrontothalamic tract, amygdalothalamic tract and dorsomedial nucleus of thalamus. Abbreviations: amygdalothalamic tract, CI: cognitive impairment, MD: Mean diffusivity. OFT: orbitofrontothalamic tract, RD: radial diffusivity, vol_adj: adjusted volume.

